When Burnley got beat 3-1 by Everton at Goodison Park on the 15th April, 33 games into their Premier League season, they’d gained only 4 points out of a possible 51 in their away fixtures. But during this time they’d also managed to accrue 32 points out of a possible 48 at Turf Moor; if the league table were based upon only home fixtures, they’d be in a highly impressive 6th place. But they were in 14th position in the real world, and would be rock bottom of the opposite hypothetical league which counted only away fixtures.
Newspapers seem to love rattling out stats like these but they’re often just cherry-picking data. Why 33 games? What if Burnley won their next two home games and lost their next away game - these figures would be even more mind-blowing. What if they started winning away games and the pattern goes cold? Stats can often be manipulated to fit any narrative, and this is especially true in football reporting; here from ‘Fortress Turf Moor’ or ‘Poor travellers Burnley destined for relegation’.
With just two games to go, Burnley are all but mathematically safe from relegation, but I wanted to look at the data to see whether they managed to cure their homesickness and how their skewed ratio of home:away points measures up to previous records. And whilst we’re here, have any teams showed a wanderlust, preferring to pick up more of their points from away fixtures?
Let’s fire up R. I’ve used the package engsoccerdata which includes databases of historical results from English (and European) football leagues and several built-in functions for analysing its data.
devtools::install_github("jalapic/engsoccerdata")
require(engsoccerdata)
require(dplyr)
require(ggplot2)
First, we need to update the engsoccerdata database with results from the current season using england_current() function and subset the dates as we’re only interested in the PL era for this post (1992-93 - 2016-17).
#update 'england' dataframe if needed
england <- rbind(england, subset(england_current(), !(Date %in% england$Date & home %in% england$home)))

#subset
EPL <- rbind(england, england_current()) %>%
  subset(tier == 1 & Season %in% 1992:2016)
Have a quick look to make sure it’s up to date.
tail(EPL, 5)
##              Date Season         home           visitor  FT hgoal vgoal
## 192355 2017-05-06   2016 Swansea City           Everton 1-0     1     0
## 192356 2017-05-07   2016      Arsenal Manchester United 2-0     2     0
## 192357 2017-05-07   2016    Liverpool       Southampton 0-0     0     0
## 192358 2017-05-08   2016      Chelsea     Middlesbrough 3-0     3     0
## 192359 2017-05-10   2016  Southampton           Arsenal 0-2     0     2
##        division tier totgoal goaldif result
## 192355        1    1       1       1      H
## 192356        1    1       2       2      H
## 192357        1    1       0       0      D
## 192358        1    1       3       3      H
## 192359        1    1       2      -2      A
Next I’ve created a custom function, maketable_ha(), to make league tables for each PL season: one using only home fixtures for each team and another using only away fixtures.
maketable_ha <- function(df=NULL, Season=NULL, tier=NULL, pts=3, type = c("both", "home", "away")) {

  GA<-GF<-ga<-gf<-gd<-GD<-D<-L<-W<-Pts<-.<-Date<-home<-team<-visitor<-hgoal<-opp<-vgoal<-goaldif <-FT<-division<-result<-maxgoal<-mingoal<-absgoaldif<-NULL

  #subset by season and tier, if applicable
  if(!is.null(Season) & is.null(tier)) {
    dfx <- df[(df$Season == Season), ]
  } else if(is.null(Season) & !is.null(tier)) {
    dfx <- df[(df$tier == tier), ]
  } else if(!is.null(Season) & !is.null(tier)) {
    dfx <- df[(df$Season == Season & df$tier == tier), ]
  } else {
    dfx <- df
  }

  #subset only home or away fixtures, if applicable
  if(match.arg(type)=="home") {
    temp <- select(dfx, team=home, opp=visitor, GF=hgoal, GA=vgoal)
  } else if(match.arg(type)=="away") {
    temp <- select(dfx, team=visitor, opp=home, GF=vgoal, GA=hgoal)
  } else if(match.arg(type)=="both") {
    temp <-rbind(
        select(dfx, team=home, opp=visitor, GF=hgoal, GA=vgoal),
        select(dfx, team=visitor, opp=home, GF=vgoal, GA=hgoal)
    )
  }

  #make table
  table <- temp %>%
    mutate(GD = GF-GA) %>%
    group_by(team) %>%
    summarise(GP = sum(GD<=100),
              W = sum(GD>0),
              D = sum(GD==0),
              L = sum(GD<0),
              gf = sum(GF),
              ga = sum(GA),
              gd = sum(GD)
    ) %>%
    mutate(Pts = (W*pts) + D) %>%
    arrange(-Pts, -gd, -gf) %>%
    mutate(Pos = rownames(.)) %>%
    as.data.frame()

    table <- arrange(table, -Pts, -gd, -gf)

  return(table)

}
Home points ratio (HPR)
We’ll apply the maketable_ha() function to calculate a ‘home points ratio’, HPR: the proportion of total points that were gained at home by each team in each season (1.0 = all of a team’s points for the season were gained at home; 0.0 = no points gained at home).
dd <- lapply(unique(EPL$Season), function(x) {

  #league tables for home fixtures
  home <- maketable_ha(EPL, Season = x, tier = 1, type="home") %>%
    mutate(Hpts = Pts, GPH = GP)
  #league tables for away fixtures
  away <- maketable_ha(EPL, Season = x, tier = 1, type="away") %>%
    mutate(Apts = Pts, GPA = GP)
  #combined (real) league table
  both <- maketable_ha(EPL, Season = x, tier = 1, type="both") %>%
    mutate(real_pos = Pos)

  #merge together
  plyr::join_all(list(home, away, both), by = "team", type = 'full') %>%
    mutate(Season = x, GP = GPH + GPA, Pos = real_pos) %>%
    select(Season, team, GP, GPH, Hpts, GPA, Apts, Pos) %>%
    mutate(HPR = Hpts / (Hpts + Apts) ) %>%
    arrange(HPR)
} ) %>%
#collapse this list to a dataframe
plyr::rbind.fill() %>%
#order by ascending home points ratio
arrange(HPR)

#prettify the season variable (e.g. 2016 -> 2016/17)
dd$season <- as.factor(paste0(dd$Season, "-", substr(dd$Season+1, 3, 4)))
Let’s have a quick look at either end of this dataframe.
dd %>% select(season, team, GP, Hpts, Apts, HPR) %>% head
##    season             team GP Hpts Apts       HPR
## 1 1997-98   Crystal Palace 38   11   22 0.3333333
## 2 1993-94     Norwich City 42   21   32 0.3962264
## 3 2008-09        Hull City 38   14   21 0.4000000
## 4 2003-04 Blackburn Rovers 38   19   25 0.4318182
## 5 2014-15   Crystal Palace 38   21   27 0.4375000
## 6 2000-01  Manchester City 38   15   19 0.4411765
dd %>% select(season, team, GP, Hpts, Apts, HPR) %>% tail
##      season          team GP Hpts Apts       HPR
## 501 2016-17     Hull City 36   28    6 0.8235294
## 502 2016-17       Burnley 36   33    7 0.8250000
## 503 1999-00 Coventry City 38   37    7 0.8409091
## 504 2005-06        Fulham 38   41    7 0.8541667
## 505 1992-93  Leeds United 42   44    7 0.8627451
## 506 2009-10       Burnley 38   26    4 0.8666667
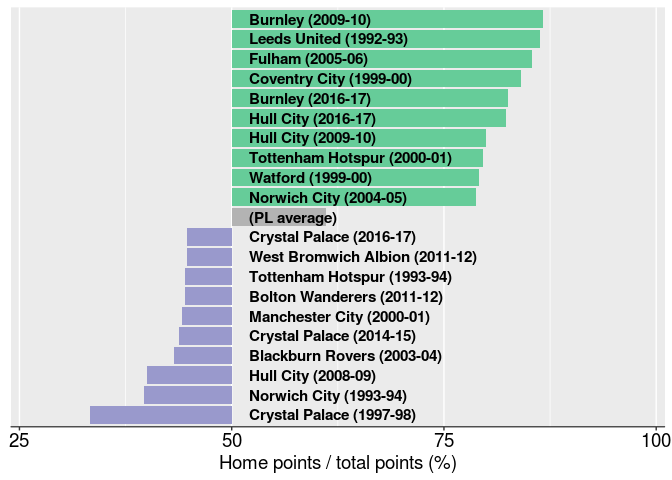
Interestingly, Burnley have the largest home points ratio, but not from this season; they gained only 4 out of 30 points (87%) away from home in the 09/10 season away. Nevertheless, this season’s Burnley also clock in at 5th place with 83% of points gained at home. Crystal Palace have the lowest HPR by quite some margin, gaining only 33% total points from home fixtures during the 97/98 season. As expected, our PL average shows a slight preference for home fixtures overall, with teams picking up 61% of their total points at home on average.
We can visualise this data by plotting the 10 largest vs. the 10 smallest HPRs and comparing them against a PL average (shown in grey). (I’ve presented HPR as a percentage as it seems more intuitive, and normalised the bars relative to 50% as this is our null hypothesis, i.e. no home or away preference.)
Click here to show code used to generate plot
Out of curiosity, here’s the same plot but for the top flight across all seasons (1888 - present; using 3 points for a win for all seasons).
Click here to show code used to generate plot
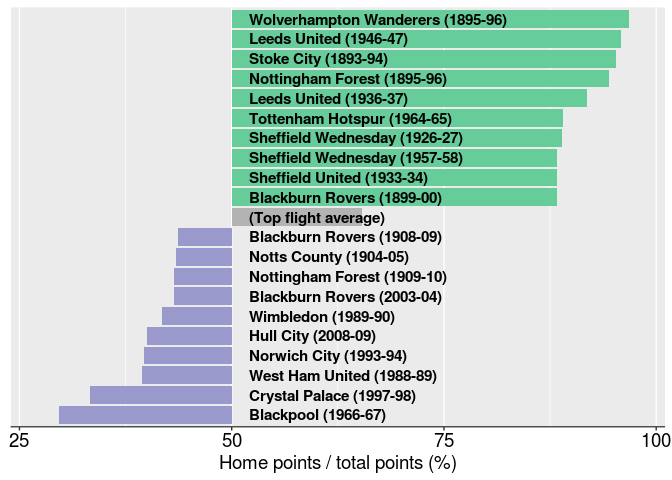
This season’s Burnley only have the 64th highest home points ratio now; 1st place goes to Wolves, who managed to gain only 1 out of their 31 points away from home in the 1895-96 season (given 3 points for a win as in the modern era). Leeds are the only other team in top flight history to equal the feat of gaining one single away point - out of 24 total points in the 1946-47 season. Blackpool hold the all time highest away points bias, picking up 19 out of 27 points away from home in the 1966-67 season.
HPR: team averages
If we pool the data from all seasons we can find out the overall home / away preferences for all past and current PL teams.
dd3 <- dd %>%
group_by(team) %>%
summarise(HPR = mean(HPR), GP = sum(GP)) %>%
arrange(HPR)

dd3 %>% tbl_df %>% print(n = nrow(.))
## # A tibble: 47 × 3
##                       team       HPR    GP
##                      <chr>     <dbl> <int>
## 1           Crystal Palace 0.5124406   310
## 2                Blackpool 0.5128205    38
## 3        Manchester United 0.5582854   959
## 4        Nottingham Forest 0.5661227   198
## 5                  Arsenal 0.5700214   959
## 6          AFC Bournemouth 0.5714286    74
## 7           Wigan Athletic 0.5742155   304
## 8                  Chelsea 0.5760889   959
## 9              Aston Villa 0.5774686   924
## 10       Charlton Athletic 0.5956775   304
## 11               Liverpool 0.5956984   960
## 12         Manchester City 0.5970030   769
## 13               Wimbledon 0.5974085   316
## 14            Ipswich Town 0.6046069   202
## 15            Leeds United 0.6047249   468
## 16    West Bromwich Albion 0.6072911   415
## 17              Sunderland 0.6079351   605
## 18       Tottenham Hotspur 0.6083261   959
## 19                 Everton 0.6094660   960
## 20            Swansea City 0.6113086   226
## 21        Blackburn Rovers 0.6118826   696
## 22          Leicester City 0.6120253   419
## 23           Coventry City 0.6158050   354
## 24     Sheffield Wednesday 0.6170957   316
## 25        Bolton Wanderers 0.6183924   494
## 26         West Ham United 0.6257402   804
## 27           Middlesbrough 0.6266046   572
## 28 Wolverhampton Wanderers 0.6301276   152
## 29            Swindon Town 0.6333333    42
## 30     Queens Park Rangers 0.6351686   278
## 31        Newcastle United 0.6415718   844
## 32             Southampton 0.6435465   693
## 33              Portsmouth 0.6523316   266
## 34               Hull City 0.6541267   188
## 35            Norwich City 0.6545060   316
## 36         Oldham Athletic 0.6548469    84
## 37         Birmingham City 0.6566897   266
## 38            Derby County 0.6583931   266
## 39              Stoke City 0.6601283   340
## 40                  Fulham 0.6642135   494
## 41            Cardiff City 0.6666667    38
## 42                 Watford 0.6669643   149
## 43        Sheffield United 0.6898336   122
## 44                 Reading 0.6909572   114
## 45                Barnsley 0.7142857    38
## 46           Bradford City 0.7264957    76
## 47                 Burnley 0.7558081   112
Interesting to see that any individual season variation in HPR is eliminated and now all teams show at least some preference for home fixtures. Nevertheless, Crystal Palace again show the lowest level of home bias (51% of points at home) and Burnley the most (76%), although Burnley have far fewer games under their belt and this could be expected to revert to a lower mean.
Points per game (ppg): home and away
One other thing we might be interested in: the absolute number of points gained at home and away, instead of their relative ratios - total points is the only statistic that matters in the end after all. To this we’ll calculate points per game (ppg) for both home (ppg_home) and away (ppg_away) fixtures.
First let’s look at each individual each season:
dd4 <- dd %>%
  mutate(ppg_home = Hpts/GPH, ppg_away = Apts/GPA) %>%
  select(season, team, GP, Pos, HPR, ppg_home, ppg_away) %>%
  arrange(desc(ppg_away))

#group by league finish: top 4, relegated, or 5th - 17th
dd4$Pos <- as.numeric(dd4$Pos)
dd4$col <- ifelse(dd4$Pos >= 18, "rel", ifelse(dd4$Pos <=4, "top", "mid"))
dd4$col <- factor(dd4$col, levels = c("top", "mid", "rel")) #reorder for plotting

rbind(head(dd4), tail(dd4))
##      season              team GP Pos       HPR  ppg_home  ppg_away col
## 1   2004-05           Chelsea 38   1 0.4947368 2.4736842 2.5263158 top
## 2   2001-02           Arsenal 38   1 0.4597701 2.1052632 2.4736842 top
## 3   2008-09           Chelsea 38   3 0.4698795 2.0526316 2.3157895 top
## 4   2008-09         Liverpool 38   2 0.5000000 2.2631579 2.2631579 top
## 5   2001-02 Manchester United 38   3 0.4545455 1.8421053 2.2105263 top
## 6   2007-08           Chelsea 38   2 0.5058824 2.2631579 2.2105263 top
## 501 1992-93      Leeds United 42  17 0.8627451 2.0952381 0.3333333 mid
## 502 2015-16       Aston Villa 38  20 0.6470588 0.5789474 0.3157895 rel
## 503 2009-10         Hull City 38  19 0.8000000 1.2631579 0.3157895 rel
## 504 1999-00           Watford 38  20 0.7916667 1.0000000 0.2631579 rel
## 505 2009-10           Burnley 38  18 0.8666667 1.3684211 0.2105263 rel
## 506 2007-08      Derby County 38  20 0.7272727 0.4210526 0.1578947 rel
Click here to show code used to generate plot
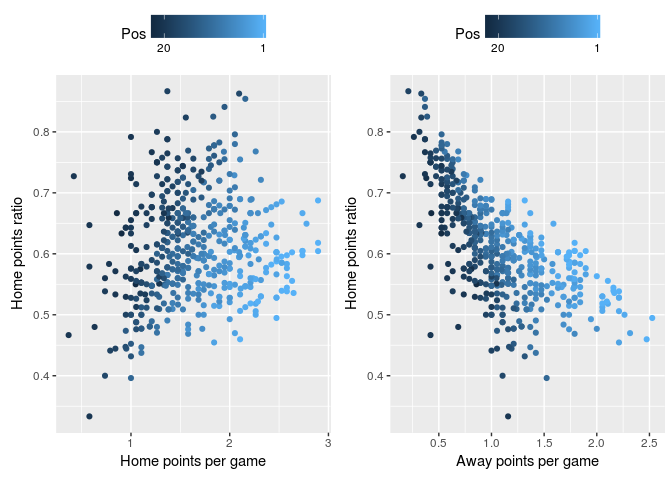
So teams who finish the season with a higher HPR seem to finish lower down the table; more of a case of faring poorly away than being excellent at home. Meanwhile, those near the top tend to have a more equal home / away points ratio.
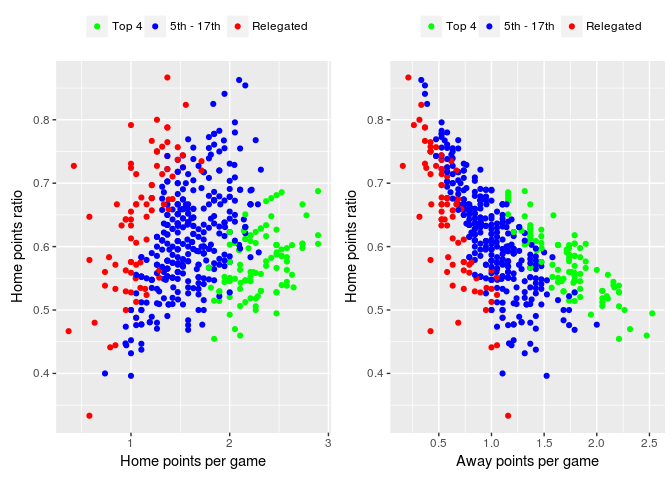
Here’s the same figures with three colour groups get a better feel for finishing position:
Click here to show code used to generate plot
So to win the league you’ve got to pick up high points per game home and away, right? Let’s look at the records for every PL winner:
dd4[dd4$Pos==1,] %>% arrange(HPR)
##     season              team GP Pos       HPR ppg_home ppg_away col
## 1  2001-02           Arsenal 38   1 0.4597701 2.105263 2.473684 top
## 2  2004-05           Chelsea 38   1 0.4947368 2.473684 2.526316 top
## 3  2015-16    Leicester City 38   1 0.5185185 2.210526 2.052632 top
## 4  1993-94 Manchester United 42   1 0.5217391 2.285714 2.095238 top
## 5  2006-07 Manchester United 38   1 0.5280899 2.473684 2.210526 top
## 6  2016-17           Chelsea 35   1 0.5357143 2.647059 2.166667 top
## 7  1999-00 Manchester United 38   1 0.5384615 2.578947 2.210526 top
## 8  2012-13 Manchester United 38   1 0.5393258 2.526316 2.157895 top
## 9  2003-04           Arsenal 38   1 0.5444444 2.578947 2.157895 top
## 10 1996-97 Manchester United 38   1 0.5466667 2.157895 1.789474 top
## 11 2008-09 Manchester United 38   1 0.5555556 2.631579 2.105263 top
## 12 1992-93 Manchester United 42   1 0.5595238 2.238095 1.761905 top
## 13 2014-15           Chelsea 38   1 0.5632184 2.578947 2.000000 top
## 14 1998-99 Manchester United 38   1 0.5822785 2.421053 1.736842 top
## 15 2000-01 Manchester United 38   1 0.5875000 2.473684 1.736842 top
## 16 1994-95  Blackburn Rovers 42   1 0.5955056 2.523810 1.714286 top
## 17 1995-96 Manchester United 38   1 0.5975610 2.578947 1.736842 top
## 18 2007-08 Manchester United 38   1 0.5977011 2.736842 1.842105 top
## 19 2002-03 Manchester United 38   1 0.6024096 2.631579 1.736842 top
## 20 1997-98           Arsenal 38   1 0.6025641 2.473684 1.631579 top
## 21 2005-06           Chelsea 38   1 0.6043956 2.894737 1.894737 top
## 22 2009-10           Chelsea 38   1 0.6046512 2.736842 1.789474 top
## 23 2013-14   Manchester City 38   1 0.6046512 2.736842 1.789474 top
## 24 2011-12   Manchester City 38   1 0.6179775 2.894737 1.789474 top
## 25 2010-11 Manchester United 38   1 0.6875000 2.894737 1.315789 top
Well, Manchester United won the league in 2010-11 with only 1.32 ppg away from home. And on the flip side, Arsenal became champions in 2001-02 with a higher ppg from away fixtures (2.47) than home (2.10). For comparison, the median overall ppg (home and away fixtures) for PL winners is 2.29 (87 points), although United managed to win it in 1996-97 with an unbelievable 75 points (1.97 ppg)… (To put that into soul-destroying persepective as a Liverpool fan, Liverpool got 84 points when they finished runners-up in 2013-14.)
HPR vs. ppg_home and ppg_away
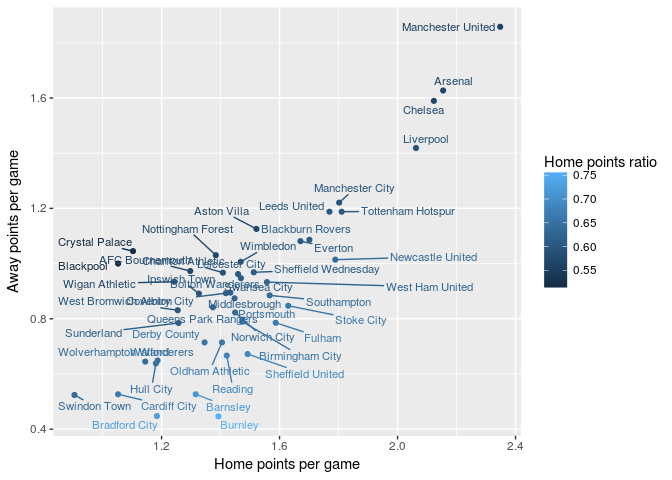
Finally, let’s pool the data for ppg_home and ppg_away as we did before to see each team’s overall record in the PL.
dd5 <- dd %>%
  group_by(team) %>%
  summarise(ppg_home = sum(Hpts) / sum(GPH), ppg_away = sum(Apts) / sum(GPA)) %>%
  mutate(HPR = ppg_home / (ppg_home + ppg_away)) %>%
  arrange(desc(ppg_away))

rbind(head(dd5), tail(dd5))
## # A tibble: 12 × 4
##                 team  ppg_home  ppg_away       HPR
## *              <chr>     <dbl>     <dbl>     <dbl>
## 1  Manchester United 2.3479167 1.8580376 0.5582364
## 2            Arsenal 2.1544885 1.6270833 0.5697336
## 3            Chelsea 2.1231733 1.5895833 0.5718590
## 4          Liverpool 2.0625000 1.4187500 0.5924596
## 5    Manchester City 1.8020833 1.2207792 0.5961513
## 6       Leeds United 1.7692308 1.1880342 0.5982659
## 7          Hull City 1.1808511 0.6382979 0.6491228
## 8           Barnsley 1.3157895 0.5263158 0.7142857
## 9       Cardiff City 1.0526316 0.5263158 0.6666667
## 10      Swindon Town 0.9047619 0.5238095 0.6333333
## 11     Bradford City 1.1842105 0.4473684 0.7258065
## 12           Burnley 1.3928571 0.4464286 0.7572816
If we plot home ppg against away ppg and fill according to home points ratio we can see that teams with the highest HPR tend to have the lowest number of points per game. This seems to support the idea that a high HPR is caused more by having away jitters than a home fortress.
Click here to show code used to generate plot
In conclusion…
I’m not sure how useful this information is (if at all), but I find exploring data that interests me is always a good way to get to grips with new methods or technologies; this was my first time piping with magrittr and my first time using knitr and rmarkdown.
Popular sports like football tend to generate a massive amount data but their interpretation by the mainstream media often leaves a lot to be desired. Hopefully this post shows how useful open-source databases and tools like engsoccerdata can make it easy to conduct a more rigorous analysis!