The motivation for this post came from watching yet another of Man United’s goalless games, this time against Southampton on Wednesday night. It’s one part a serious examination of United’s current trend of low scoring – how this fits in with their previous Premier League record and whether ‘negative football’ can explain their recent lack of league success – and one part the schadenfreude of a Liverpool fan looking to see if I can pronounce them The Most Boring Team Ever.
Let’s fire up R and use the most recent build of the engsoccerdata package to get all previous results in Premier League (up to 17th May 2017), as well as some packages for manipulating and visualisating the data.
First up, let’s look at United’s goalscoring record this season using the maketable_all() function:
##                    team  P  F  A  GD (Pos)
## 1     Tottenham Hotspur 38 86 26  60     2
## 2               Chelsea 38 85 33  52     1
## 3       Manchester City 38 80 39  41     3
## 4             Liverpool 38 78 42  36     4
## 5               Arsenal 38 77 44  33     5
## 6               Everton 38 62 44  18     7
## 7       AFC Bournemouth 38 55 67 -12     9
## 8     Manchester United 38 54 29  25     6
## 9        Crystal Palace 38 50 63 -13    14
## 10       Leicester City 38 48 63 -15    12
## 11      West Ham United 38 47 64 -17    11
## 12         Swansea City 38 45 70 -25    15
## 13 West Bromwich Albion 38 43 51  -8    10
## 14          Southampton 38 41 48  -7     8
## 15           Stoke City 38 41 56 -15    13
## 16              Watford 38 40 68 -28    17
## 17              Burnley 38 39 55 -16    16
## 18            Hull City 38 37 80 -43    18
## 19           Sunderland 38 29 69 -40    20
## 20        Middlesbrough 38 27 53 -26    19
They rank 8th with 54 goals scored – noticeably the lowest of the ‘top 6’; even Bournemouth have scored more than them this season.
How to quantify ‘boring’?
Thinking along the lines of measuring ‘boring’, what about making some kind of ‘excitement score’? For neutral viewers, I think the total number of goals scored in a game is often a decent measure for how exciting it was to watch.
##                    team goals goals_per_game
## 1       AFC Bournemouth   122           3.21
## 2               Arsenal   121           3.18
## 3             Liverpool   120           3.16
## 4       Manchester City   119           3.13
## 5               Chelsea   118           3.11
## 6             Hull City   117           3.08
## 7          Swansea City   115           3.03
## 8        Crystal Palace   113           2.97
## 9     Tottenham Hotspur   112           2.95
## 10      West Ham United   111           2.92
## 11       Leicester City   111           2.92
## 12              Watford   108           2.84
## 13              Everton   106           2.79
## 14           Sunderland    98           2.58
## 15           Stoke City    97           2.55
## 16 West Bromwich Albion    94           2.47
## 17              Burnley    94           2.47
## 18          Southampton    89           2.34
## 19    Manchester United    83           2.18
## 20        Middlesbrough    80           2.11
United rank 19th in this table, their 38 games offering up 83 goals. Only Middlesbrough (80) have provided less excitement for the netural, and even West Brom have produced more than United (no offence, Baggies). Bournemouth top this league with nearly 50% more excitement than United! (Their goal difference (-12) suggests things are probably a bit less exciting if you’re a Bournemouth fan though.)
Also, we can’t forget the thing that everyone seems to be saying has epitomised United’s season: the bore-draw; the nil-nil; the neutral’s dreaded 0-0. (Although there have been some examples of scintillating nil-nils; see footnote here.)
## # A tibble: 5 x 2
##                team nil_nils
##               <chr>    <int>
## 1     Middlesbrough        7
## 2       Southampton        7
## 3 Manchester United        6
## 4           Burnley        3
## 5    Leicester City        3
United have given us 6 nil-nils this season; only Boro and Southampton have offered more with by going one further.
It’s not all bad though, more clean sheets are an obvious perk to this trend of shut-outs and nil-nils – United sit joint-top of the clean sheet league with Spurs this season (17):
## # A tibble: 5 x 2
##                team clean_sheets
##               <chr>        <int>
## 1 Manchester United           17
## 2 Tottenham Hotspur           17
## 3           Chelsea           16
## 4       Southampton           14
## 5           Arsenal           13
Is this a new trend for United?
But how does this compare with previous seasons for Man Utd?
Let’s look at our throwaway excitement score first. So this season was United’s ‘least exciting’ in terms of goals per game, although only marginally lower than previous record shared between the 2015-16 season and the 2004-05 season.
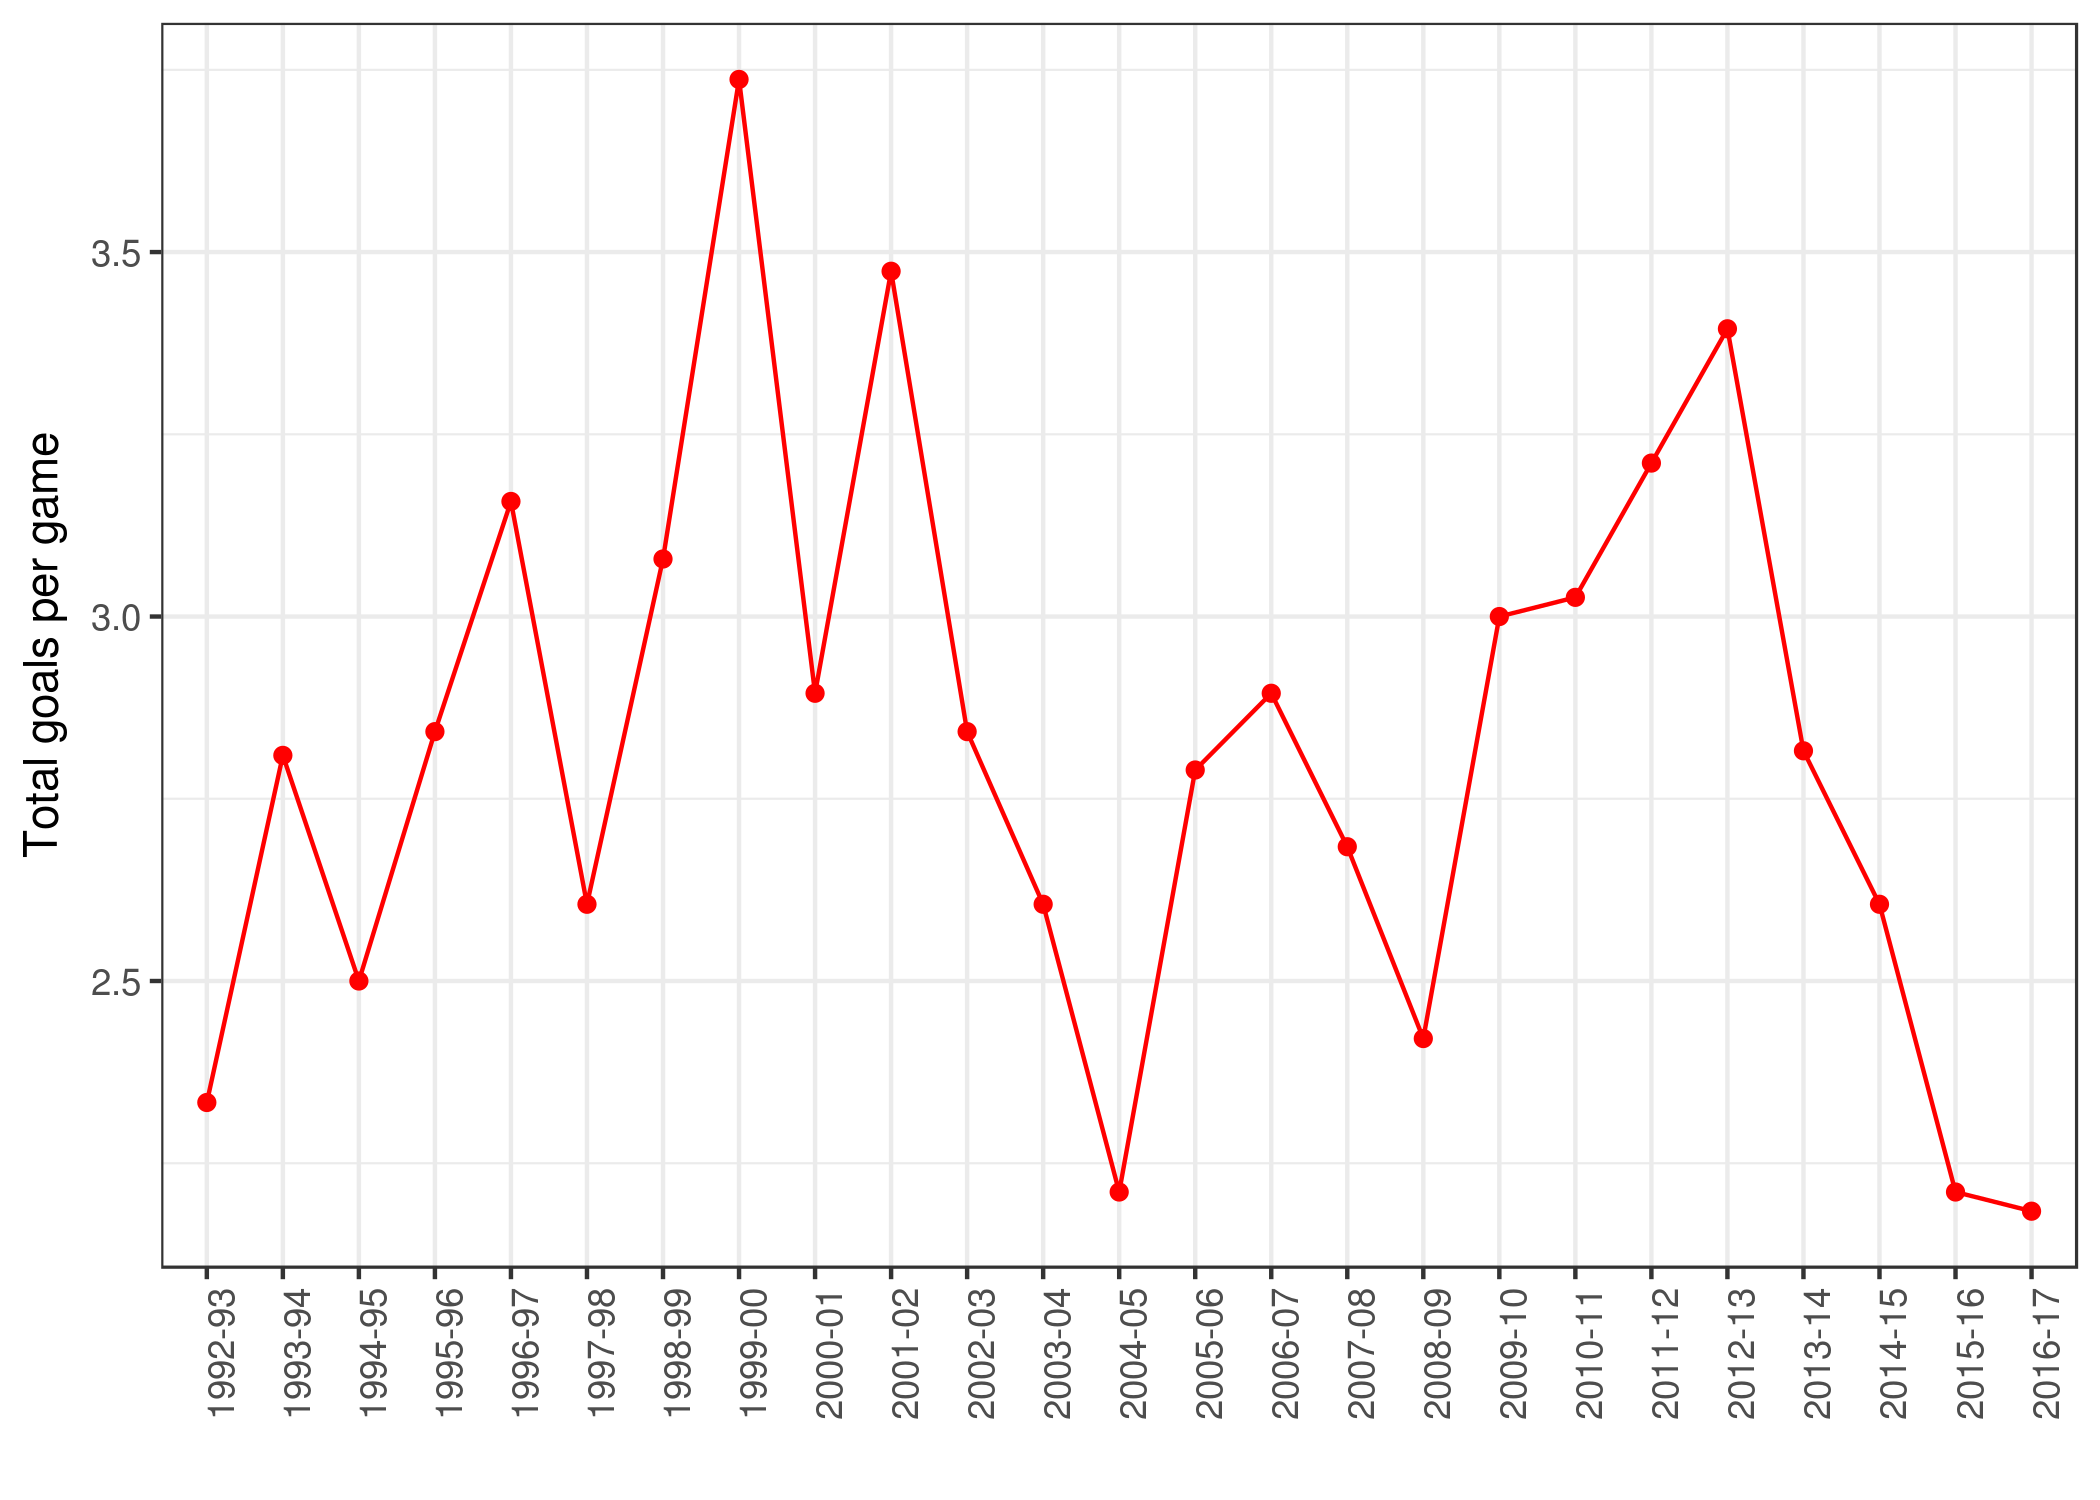
Though it has to be said that United don’t even approach the record for most boring team in a Premier League season though.
## [1] 32
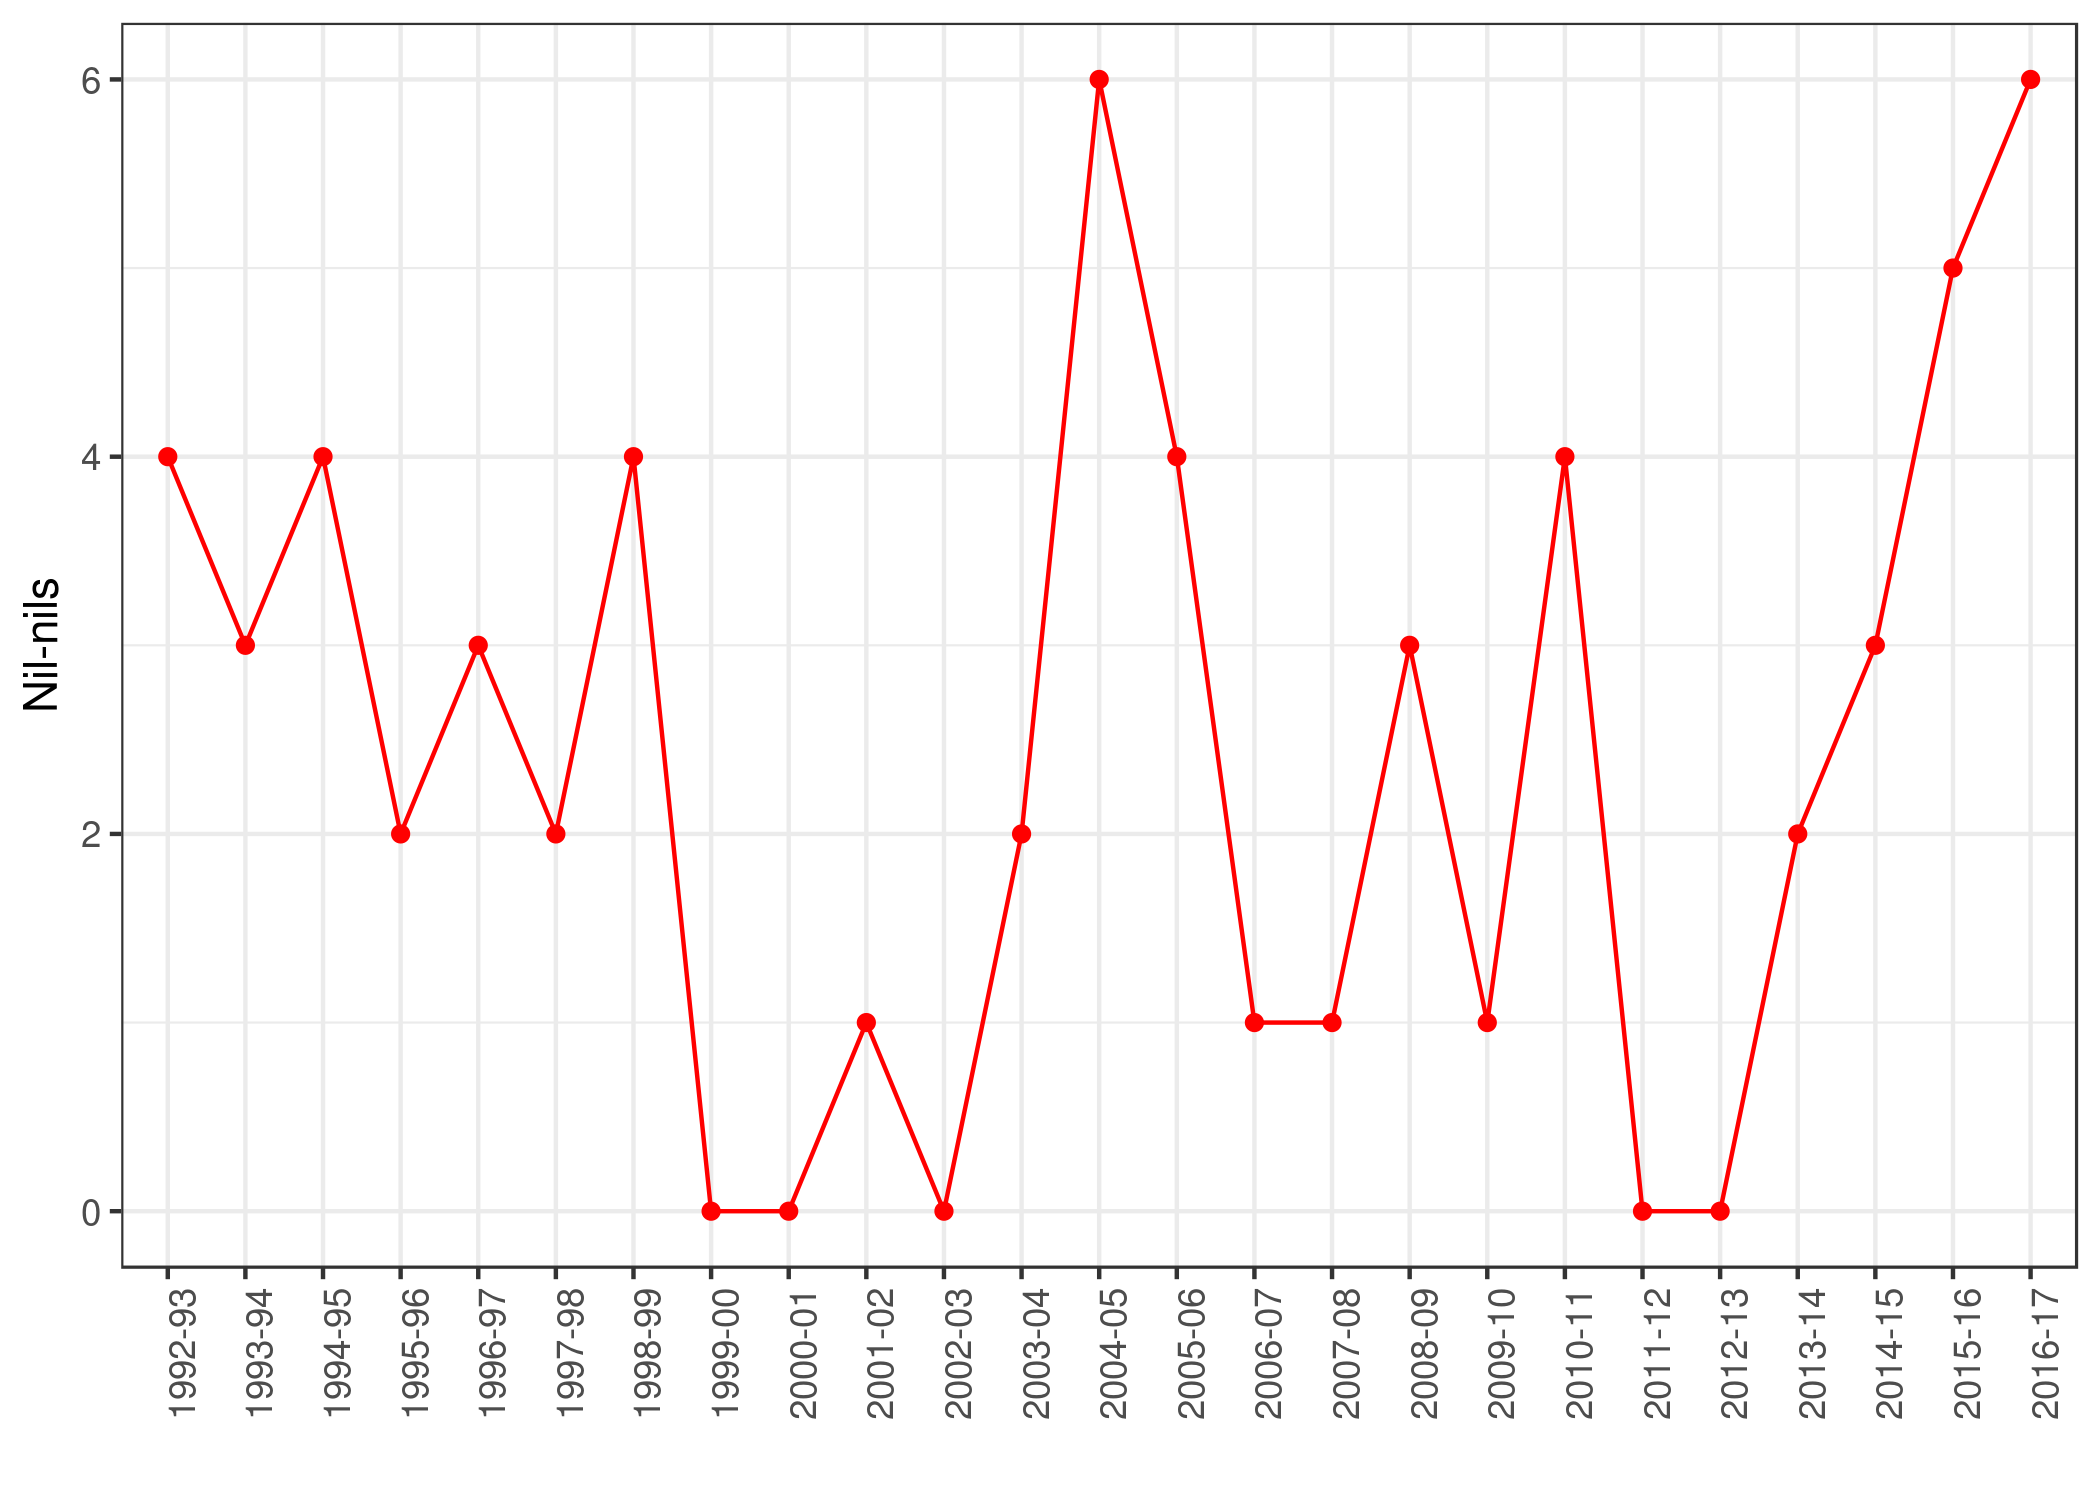
Their 2016-17 campaign ranks 32nd in the lowest number of total number of goals per game, and there have been plenty of teams producing more goalless games in a season. Leeds United can proudly hold both records for lowest excitement delivered: their 1996-97 season produced a snooze-worthy 1.74 goals per game on average and 9 nil-nils.
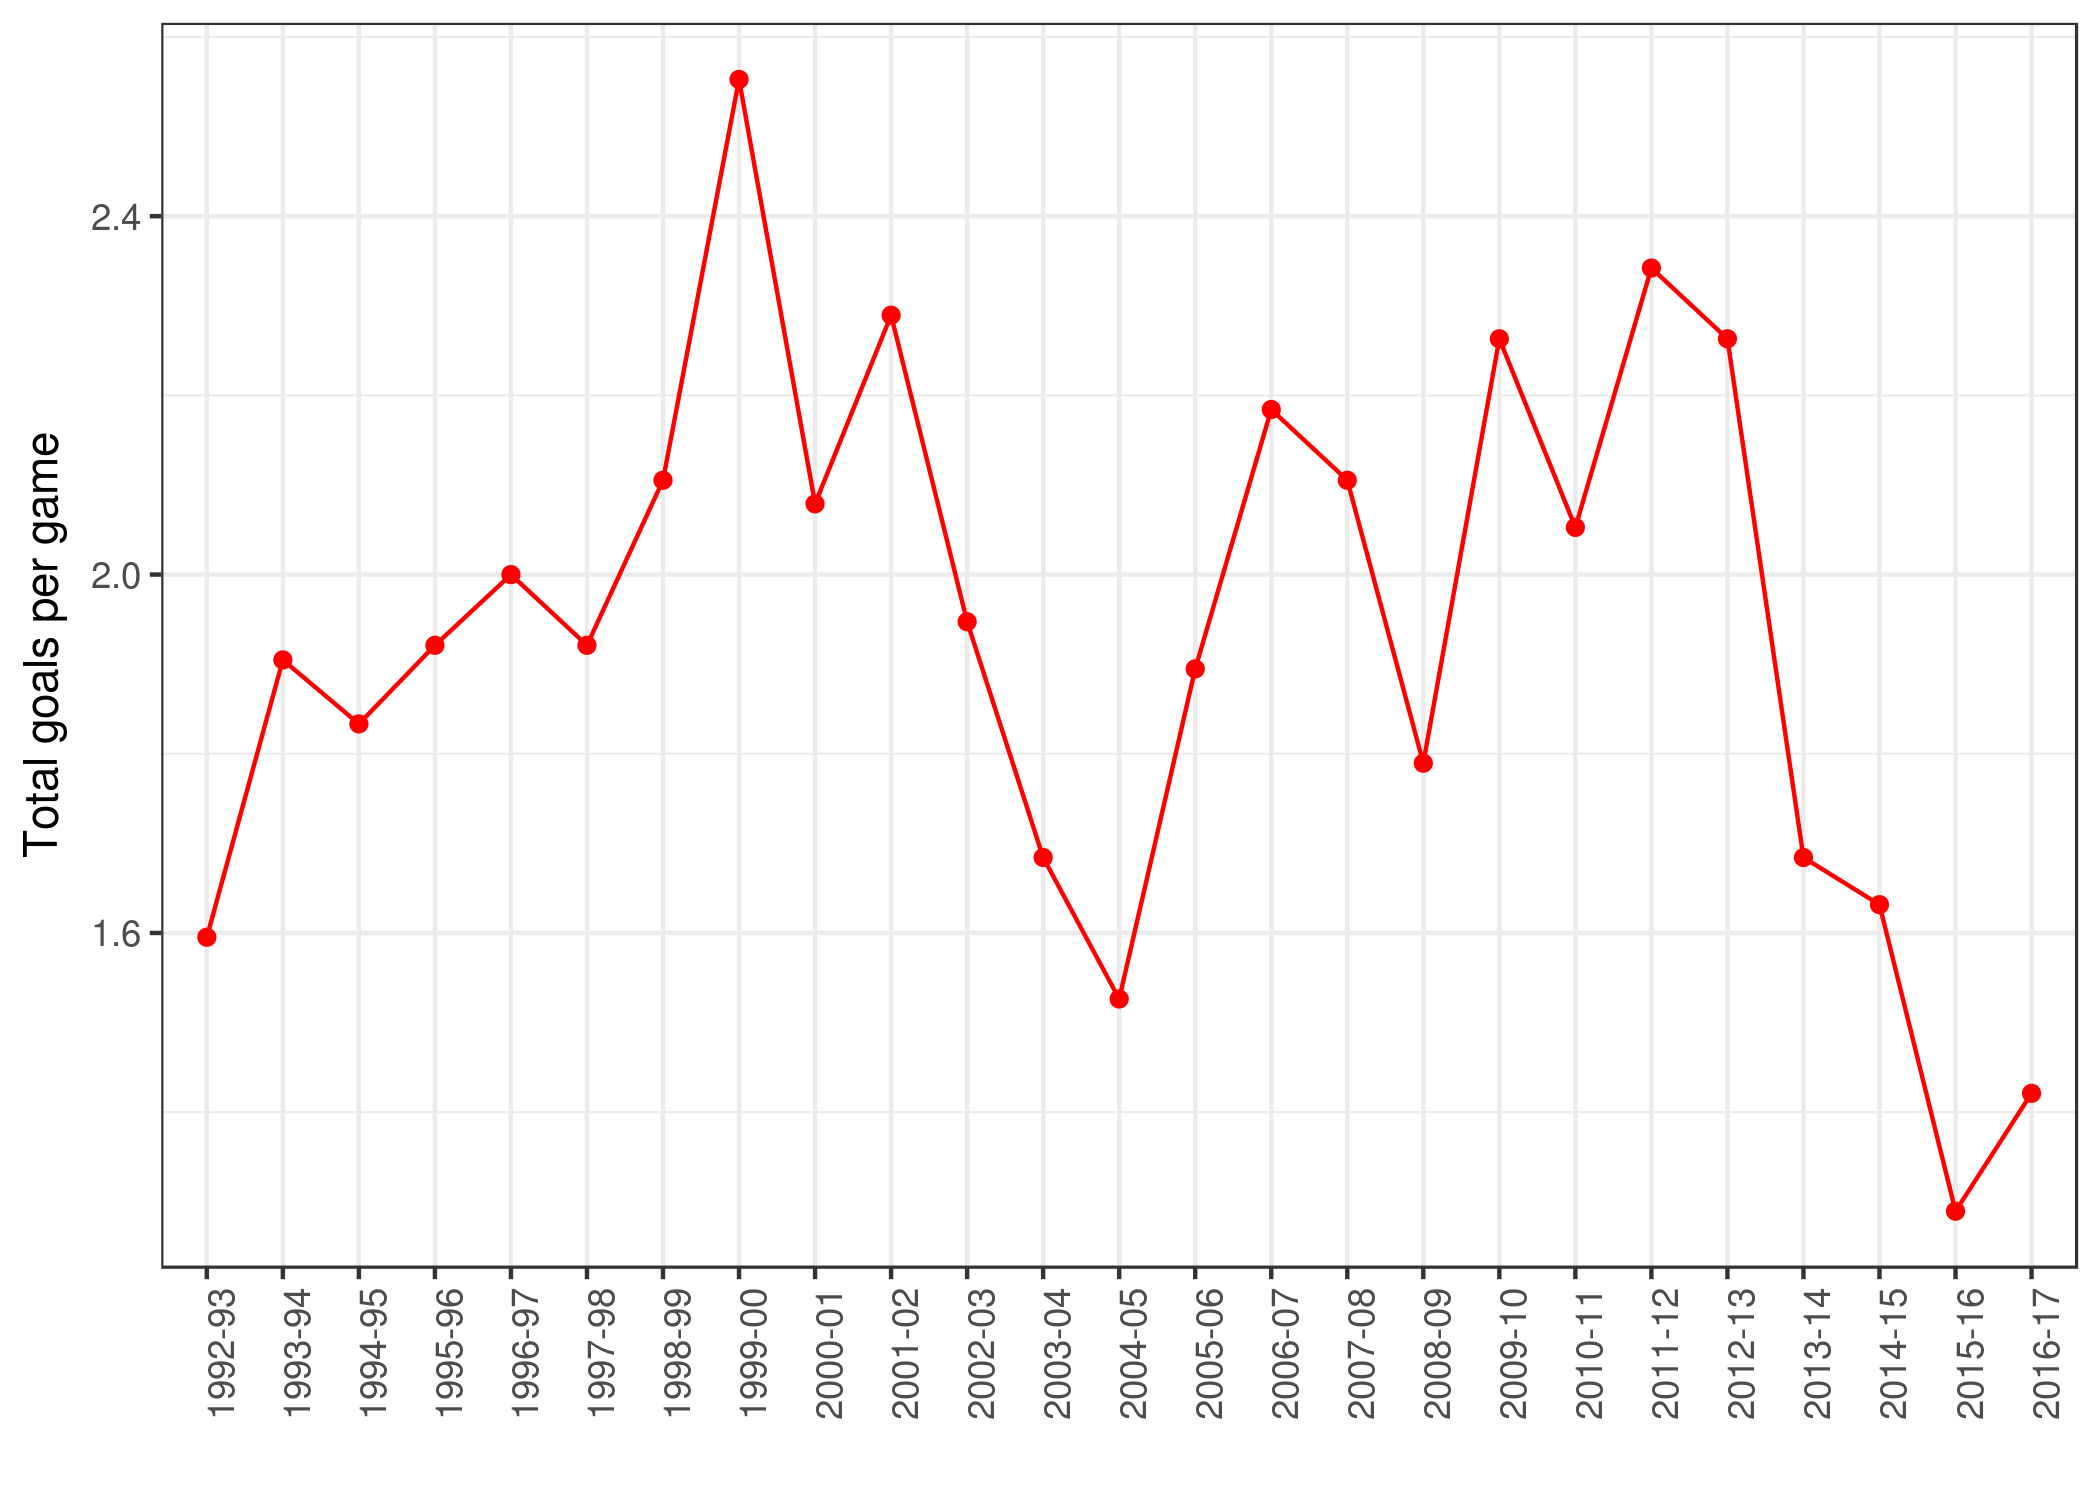
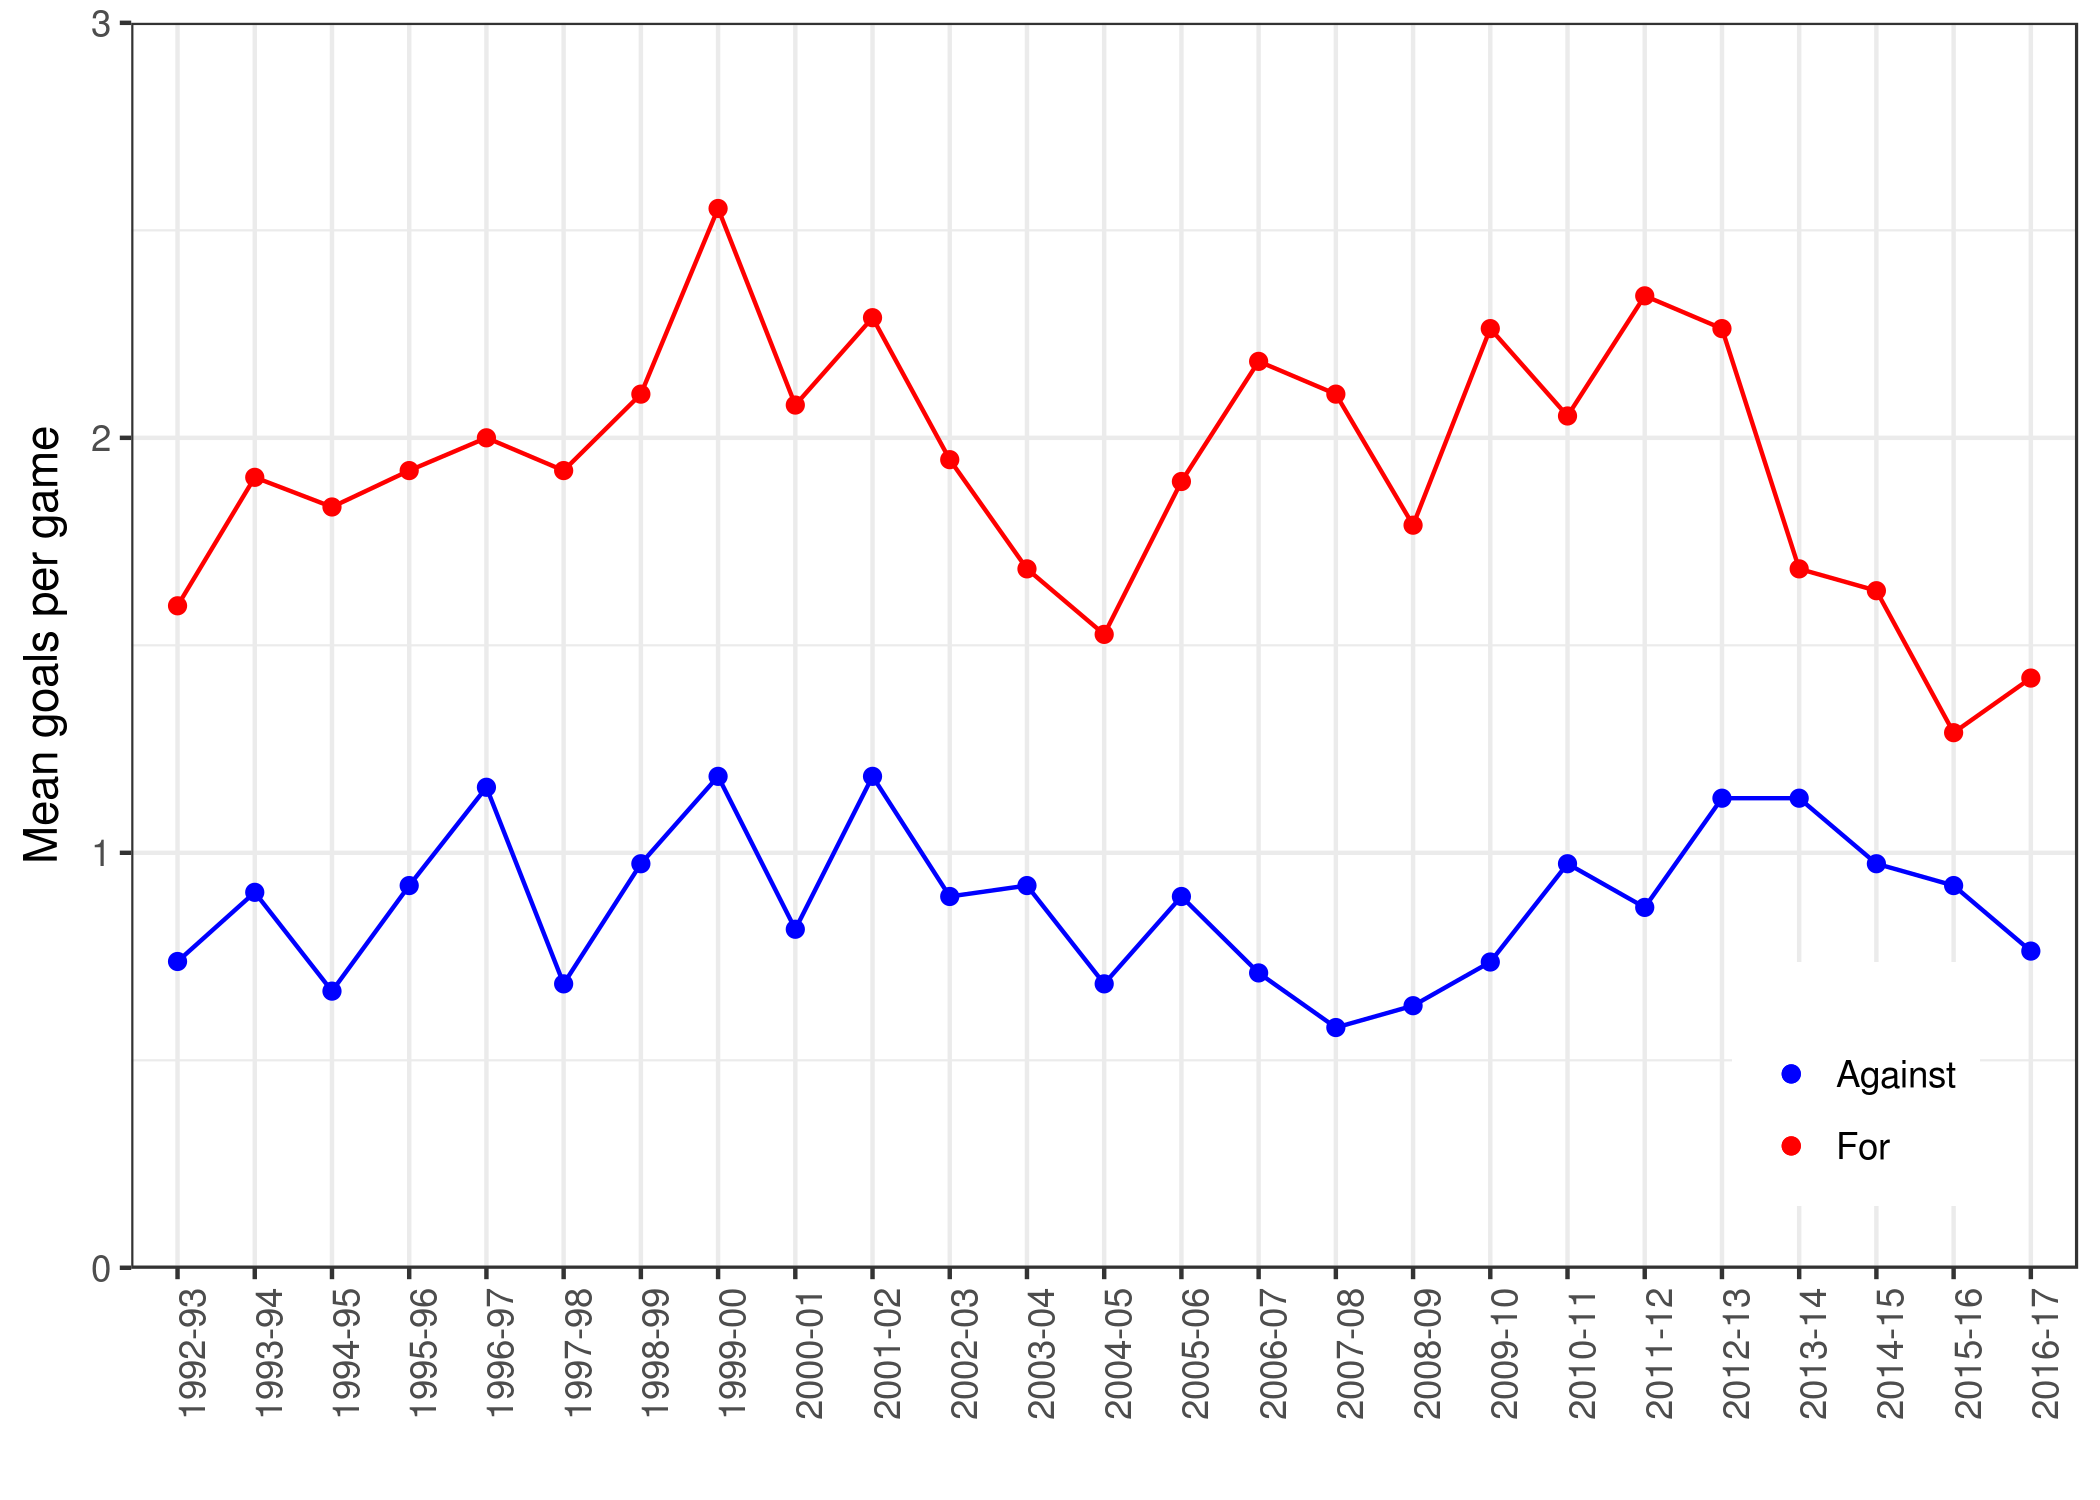
A bit more seriously, let’s focus on United’s own goalscoring. The last two seasons have saw them score the fewest goals per game in their EPL history…
…and the apparent silver lining provided by keeping more clean sheets doesn’t seem so great compared to previous seasons.
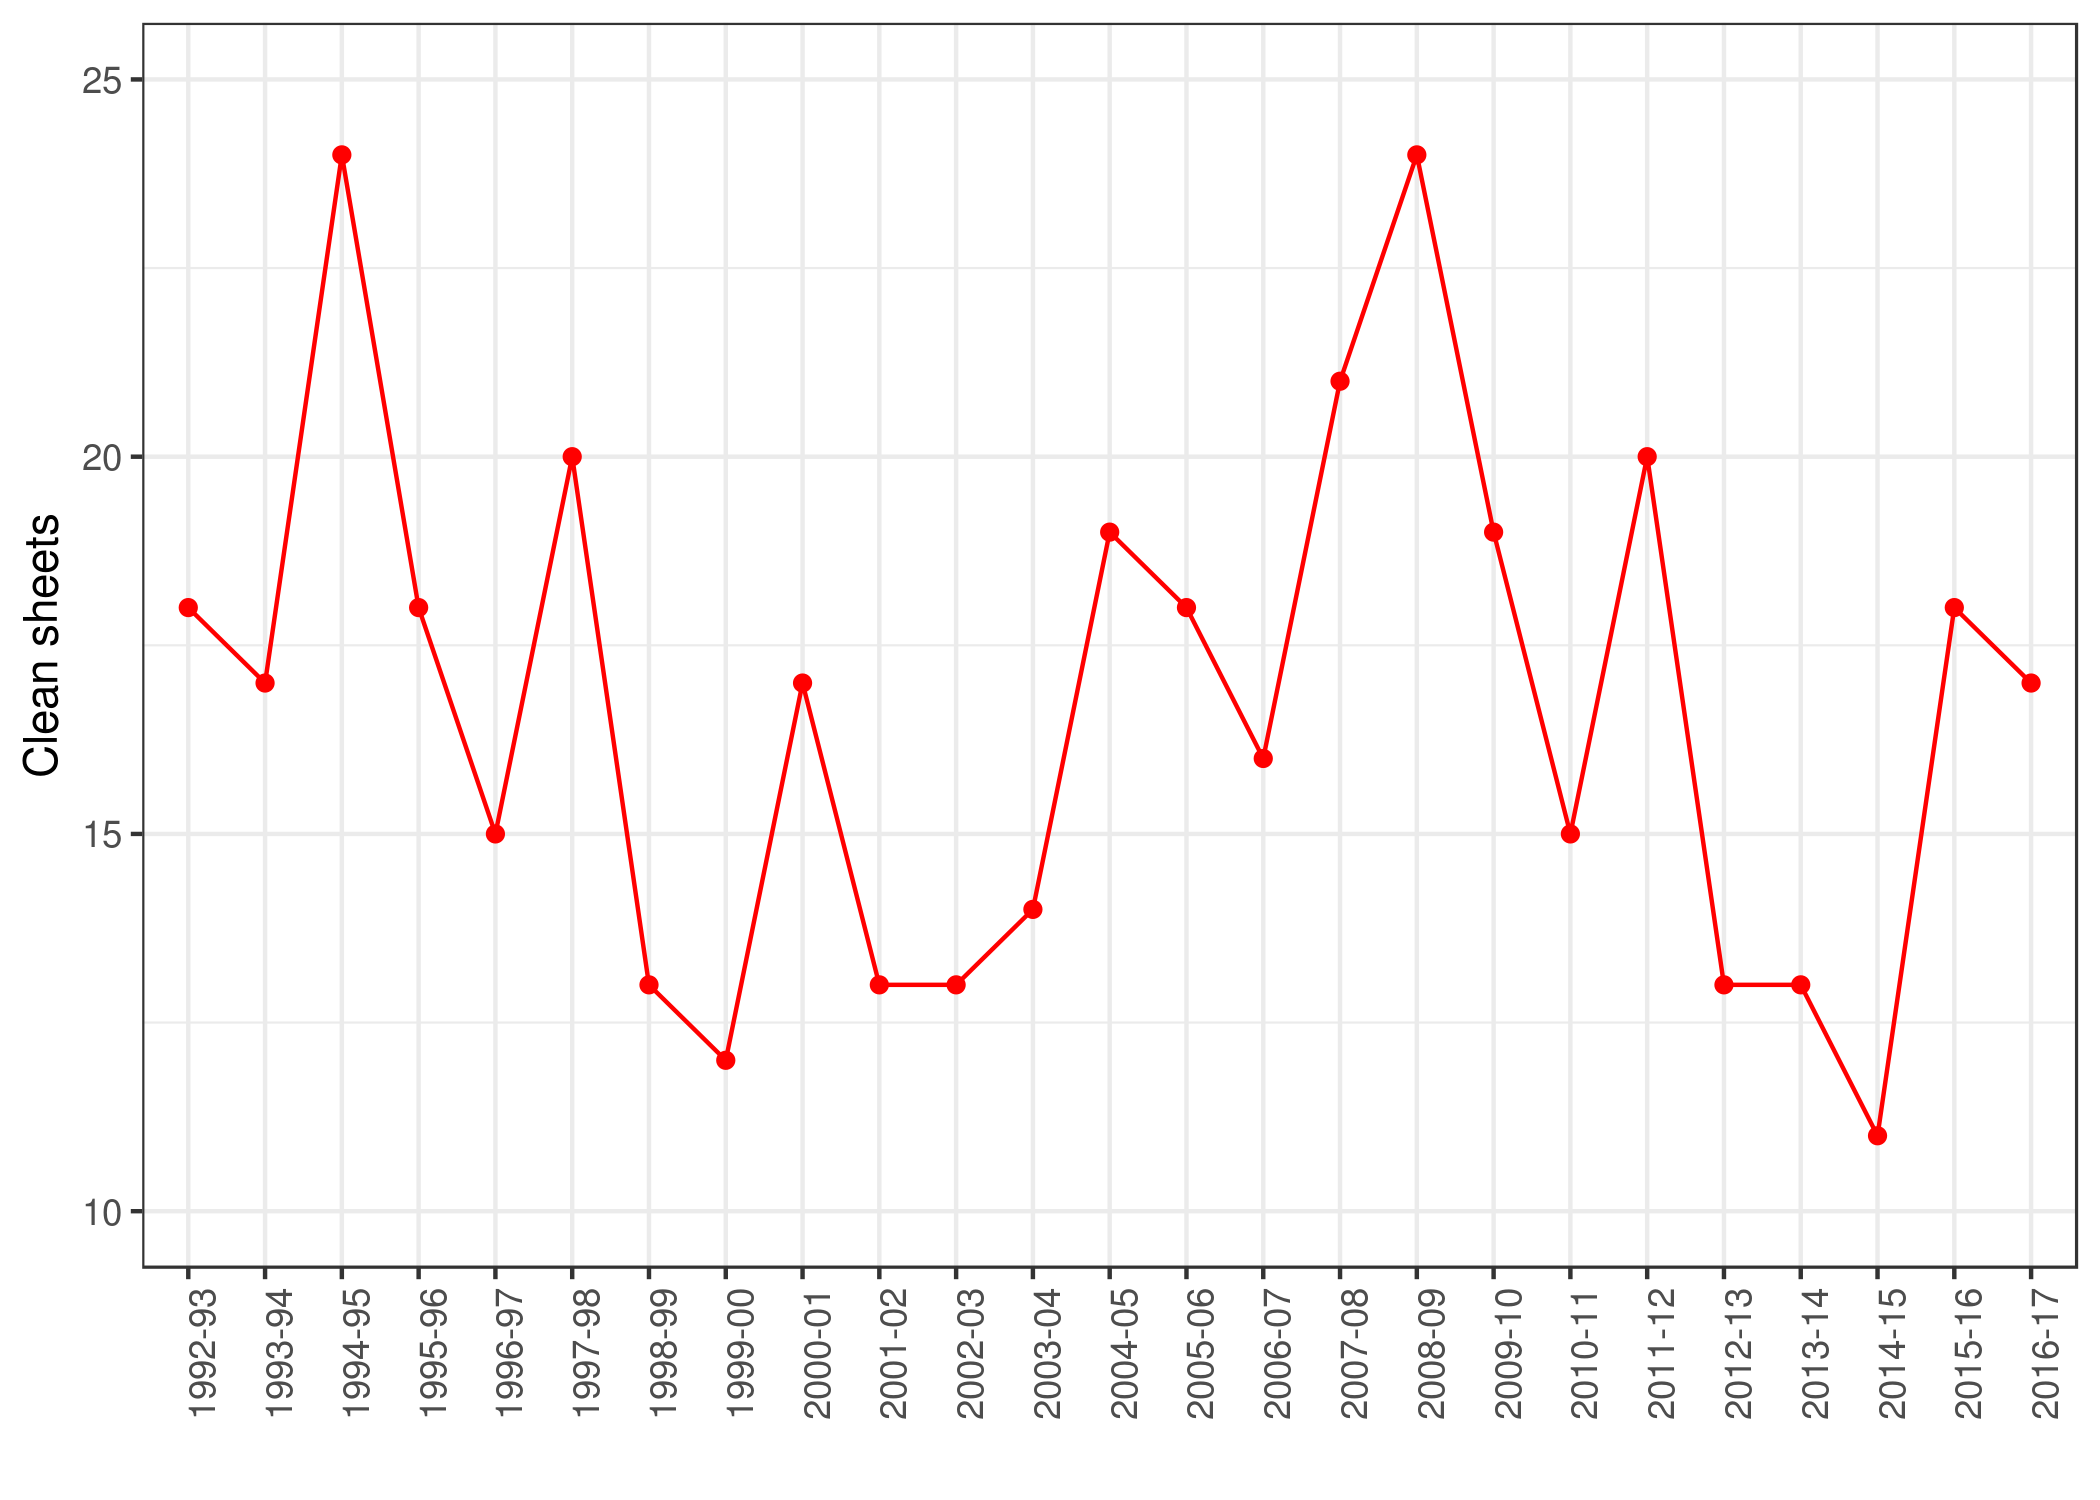
Simply put, United have scored more whilst conceding less in previous campaigns. Here’s a plot of both goals for and against over the years, just for the craic.
Going deeper than goals: shots for and against
I want to wade a bit deeper into match statistics for a bit – specifically shots for / against and shots on target for / against – to try and see whether we can show that less attacking play is what is behind this apparent goal drought.
Nothing near as fancy as the stats we might find on www.squawka.com or similar then, but we’ll need some more detailed data as this information isn’t contained in engsoccerdata package. We can use the website Football-Data, which contains historical data on matches from several European leagues. It takes a bit of effort to clean up but the home-made function getFD() gets us there.
We’ll use this function to get the shots statistics we’re after: shots for (sf), shots against (sa), shots on target for (sotf) and shots on target against (sota). We’ll normalise these to games played to account for the fact there’s still one game to play this season. (Note I’ve only gone as far back as the 2000-01 season as that’s earliest season to contain this data.) We’ll reformat it in the homeaway() style used by engsoccerdata, which let’s us look at all results from each team’s perspective.
##   Season       Date    team        opp gf ga result sf sa sotf sota venue
## 1   2000 2000-08-19 Arsenal Sunderland  0  1      A 14  8    7    2  away
## 2   2000 2000-08-21 Arsenal  Liverpool  2  0      H 17  7   12    4  home
## 3   2000 2000-08-26 Arsenal   Charlton  5  3      H 18  7    9    4  home
## 4   2000 2000-09-06 Arsenal    Chelsea  2  2      D 13 12    5    5  away
## 5   2000 2000-09-09 Arsenal   Bradford  1  1      D 18  9   11    5  away
##    season
## 1 2000-01
## 2 2000-01
## 3 2000-01
## 4 2000-01
## 5 2000-01
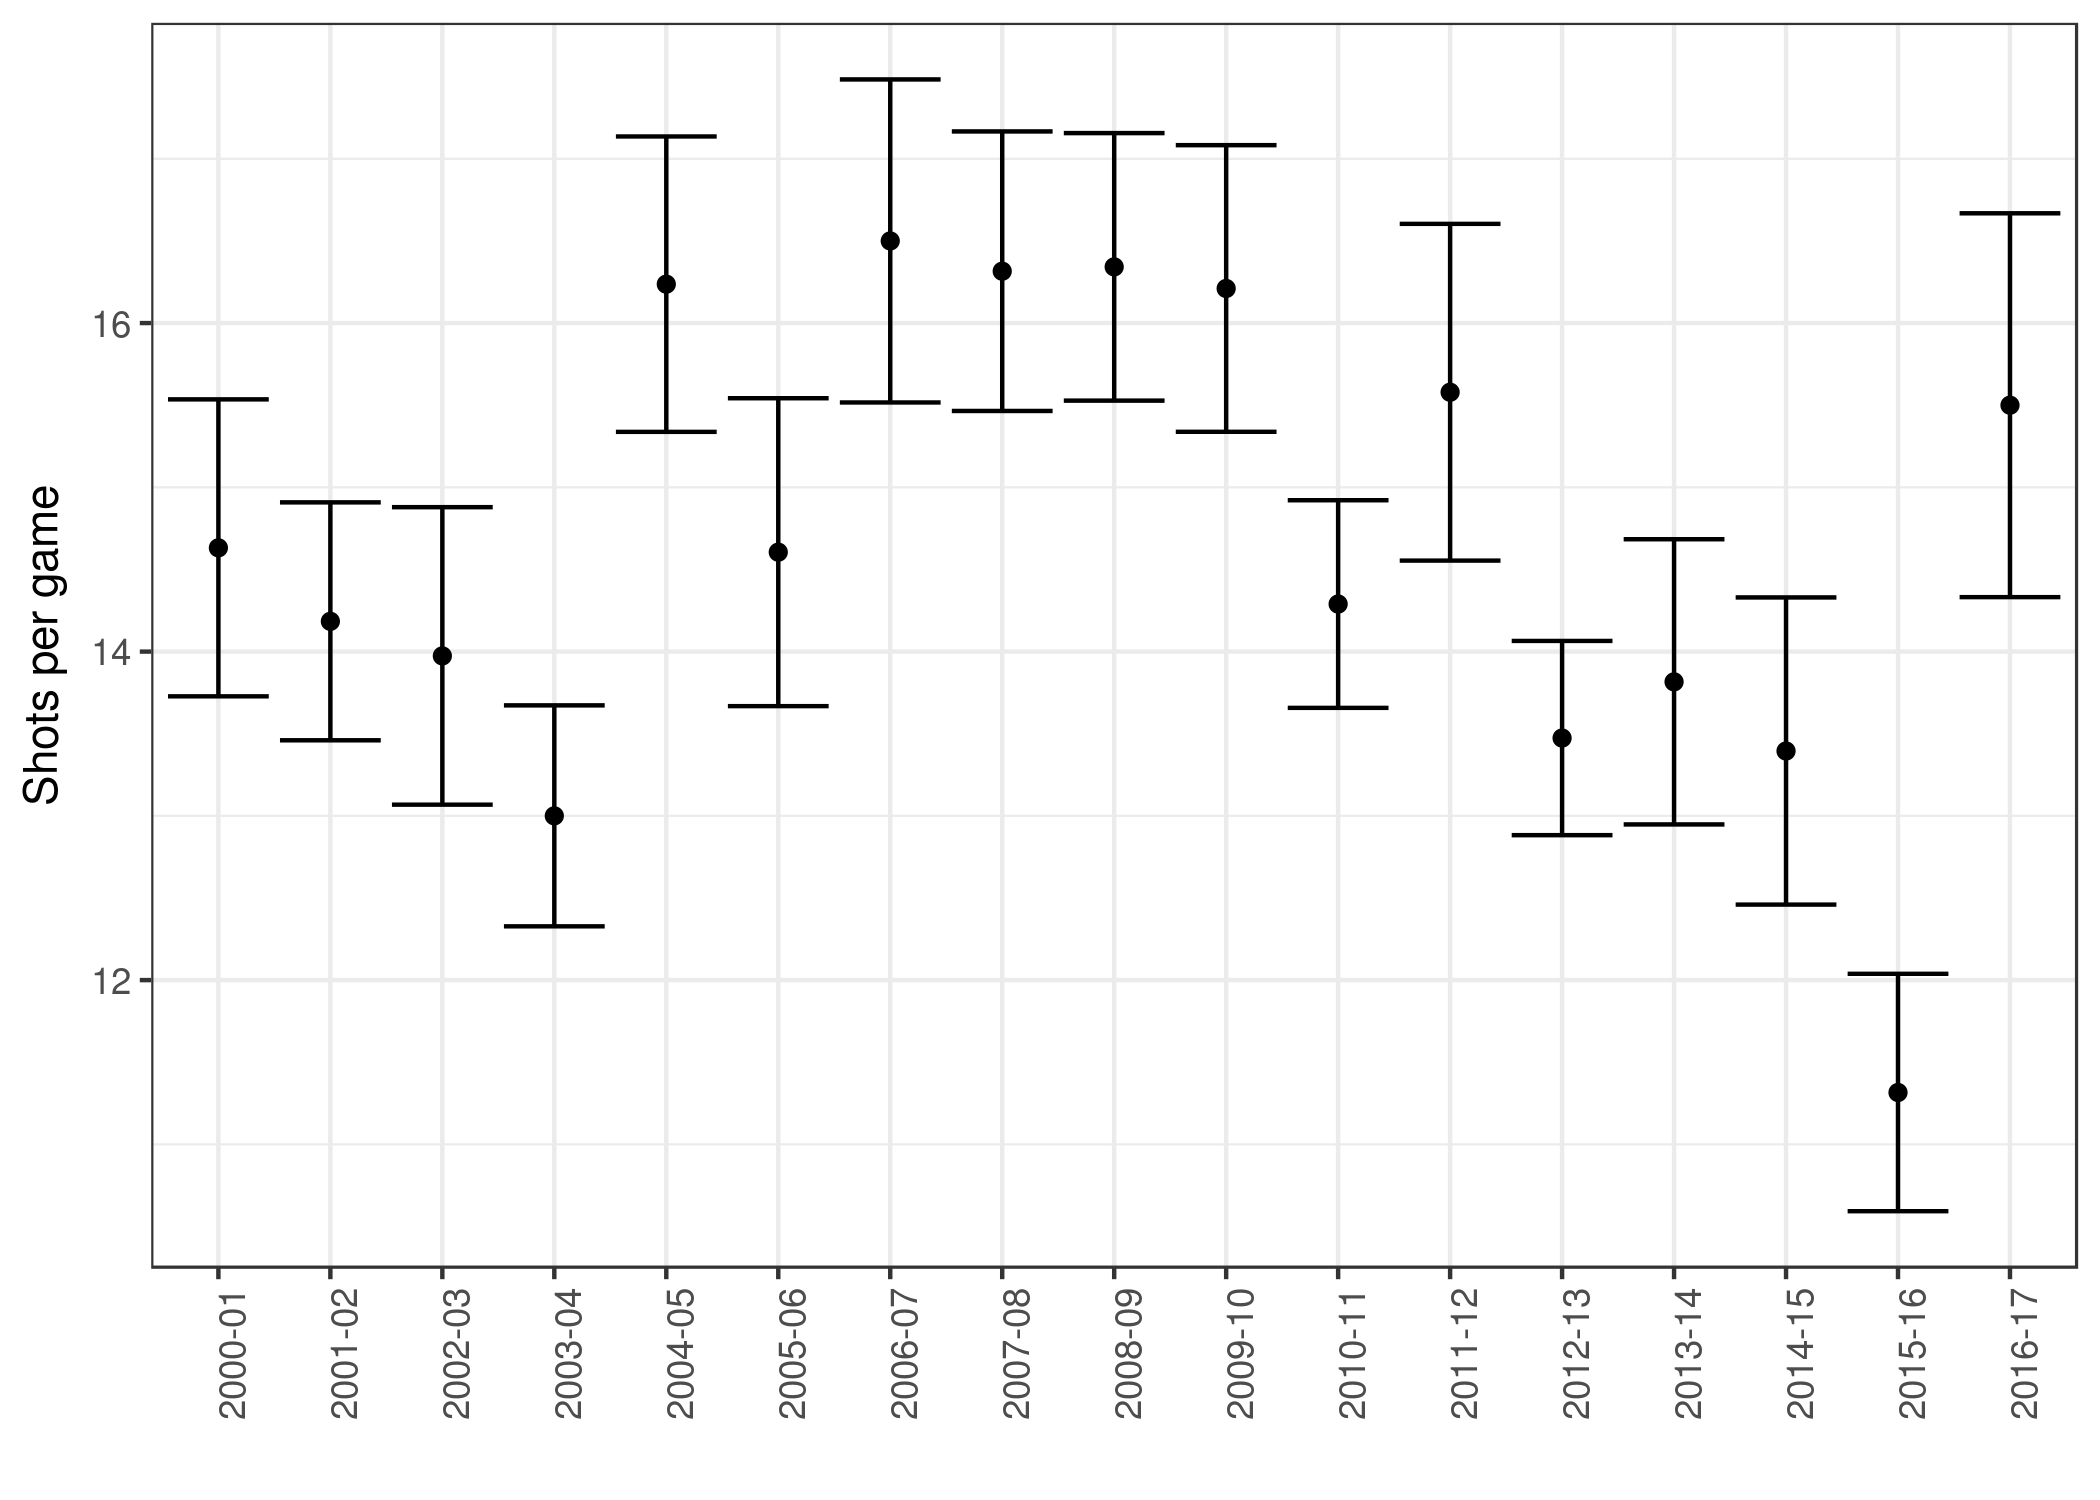
So now we’ve got the data cleaned up an ready to go, let’s look at United’s previous records for shots for and against. First, shots on goal was at its lowest last season but looks back to normal this season.
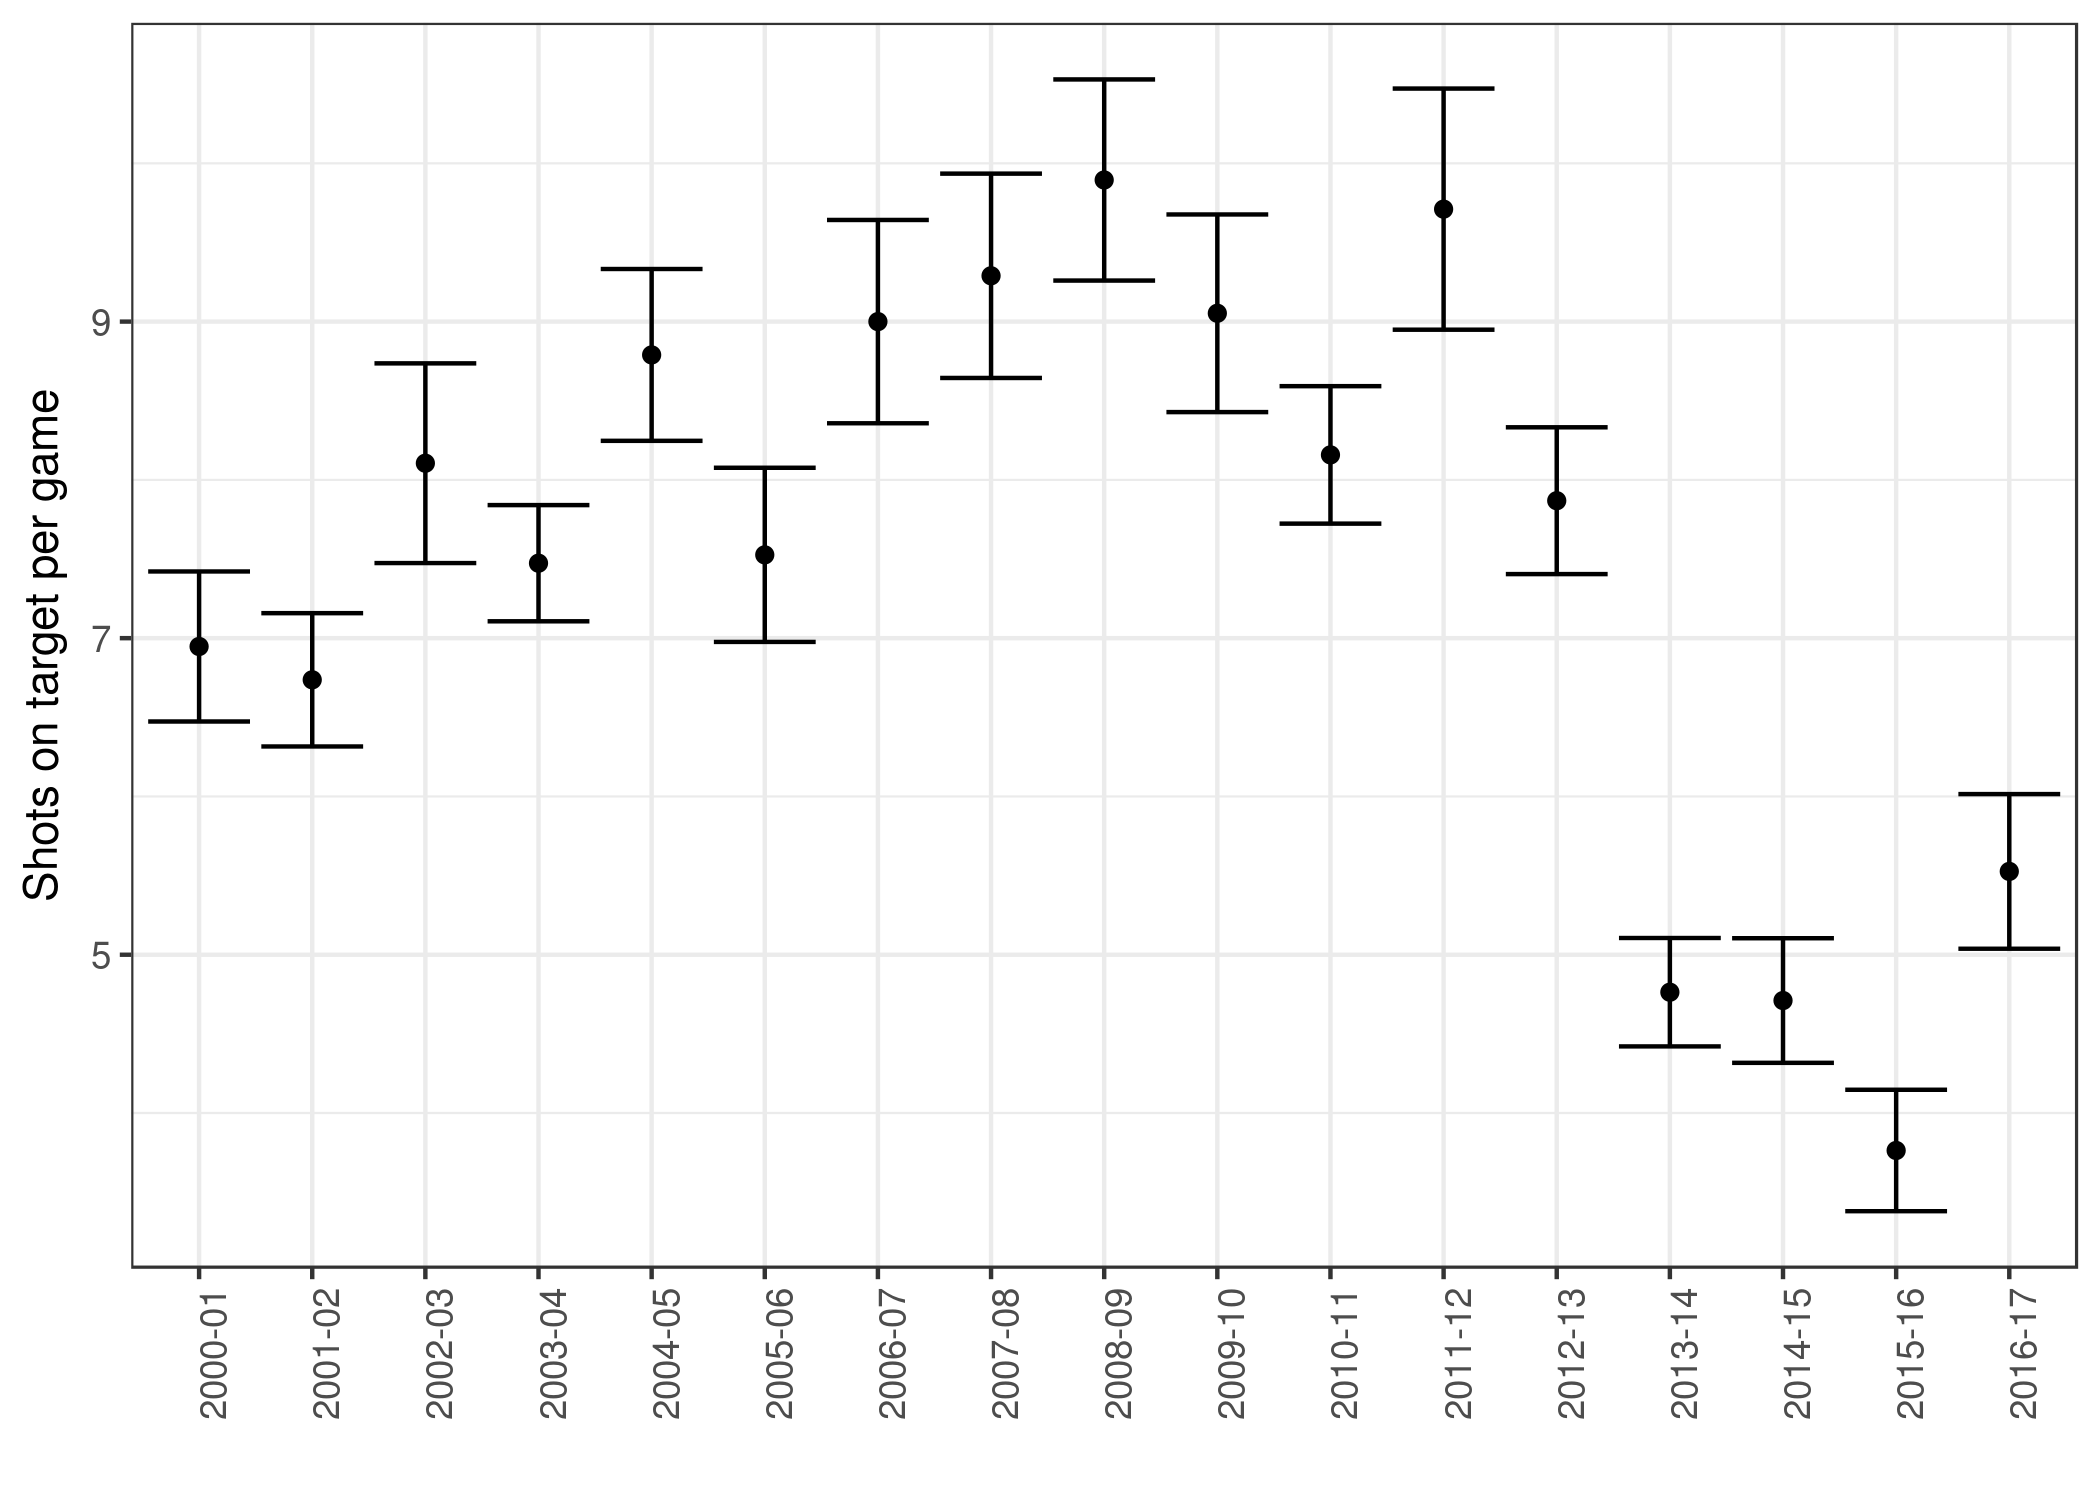
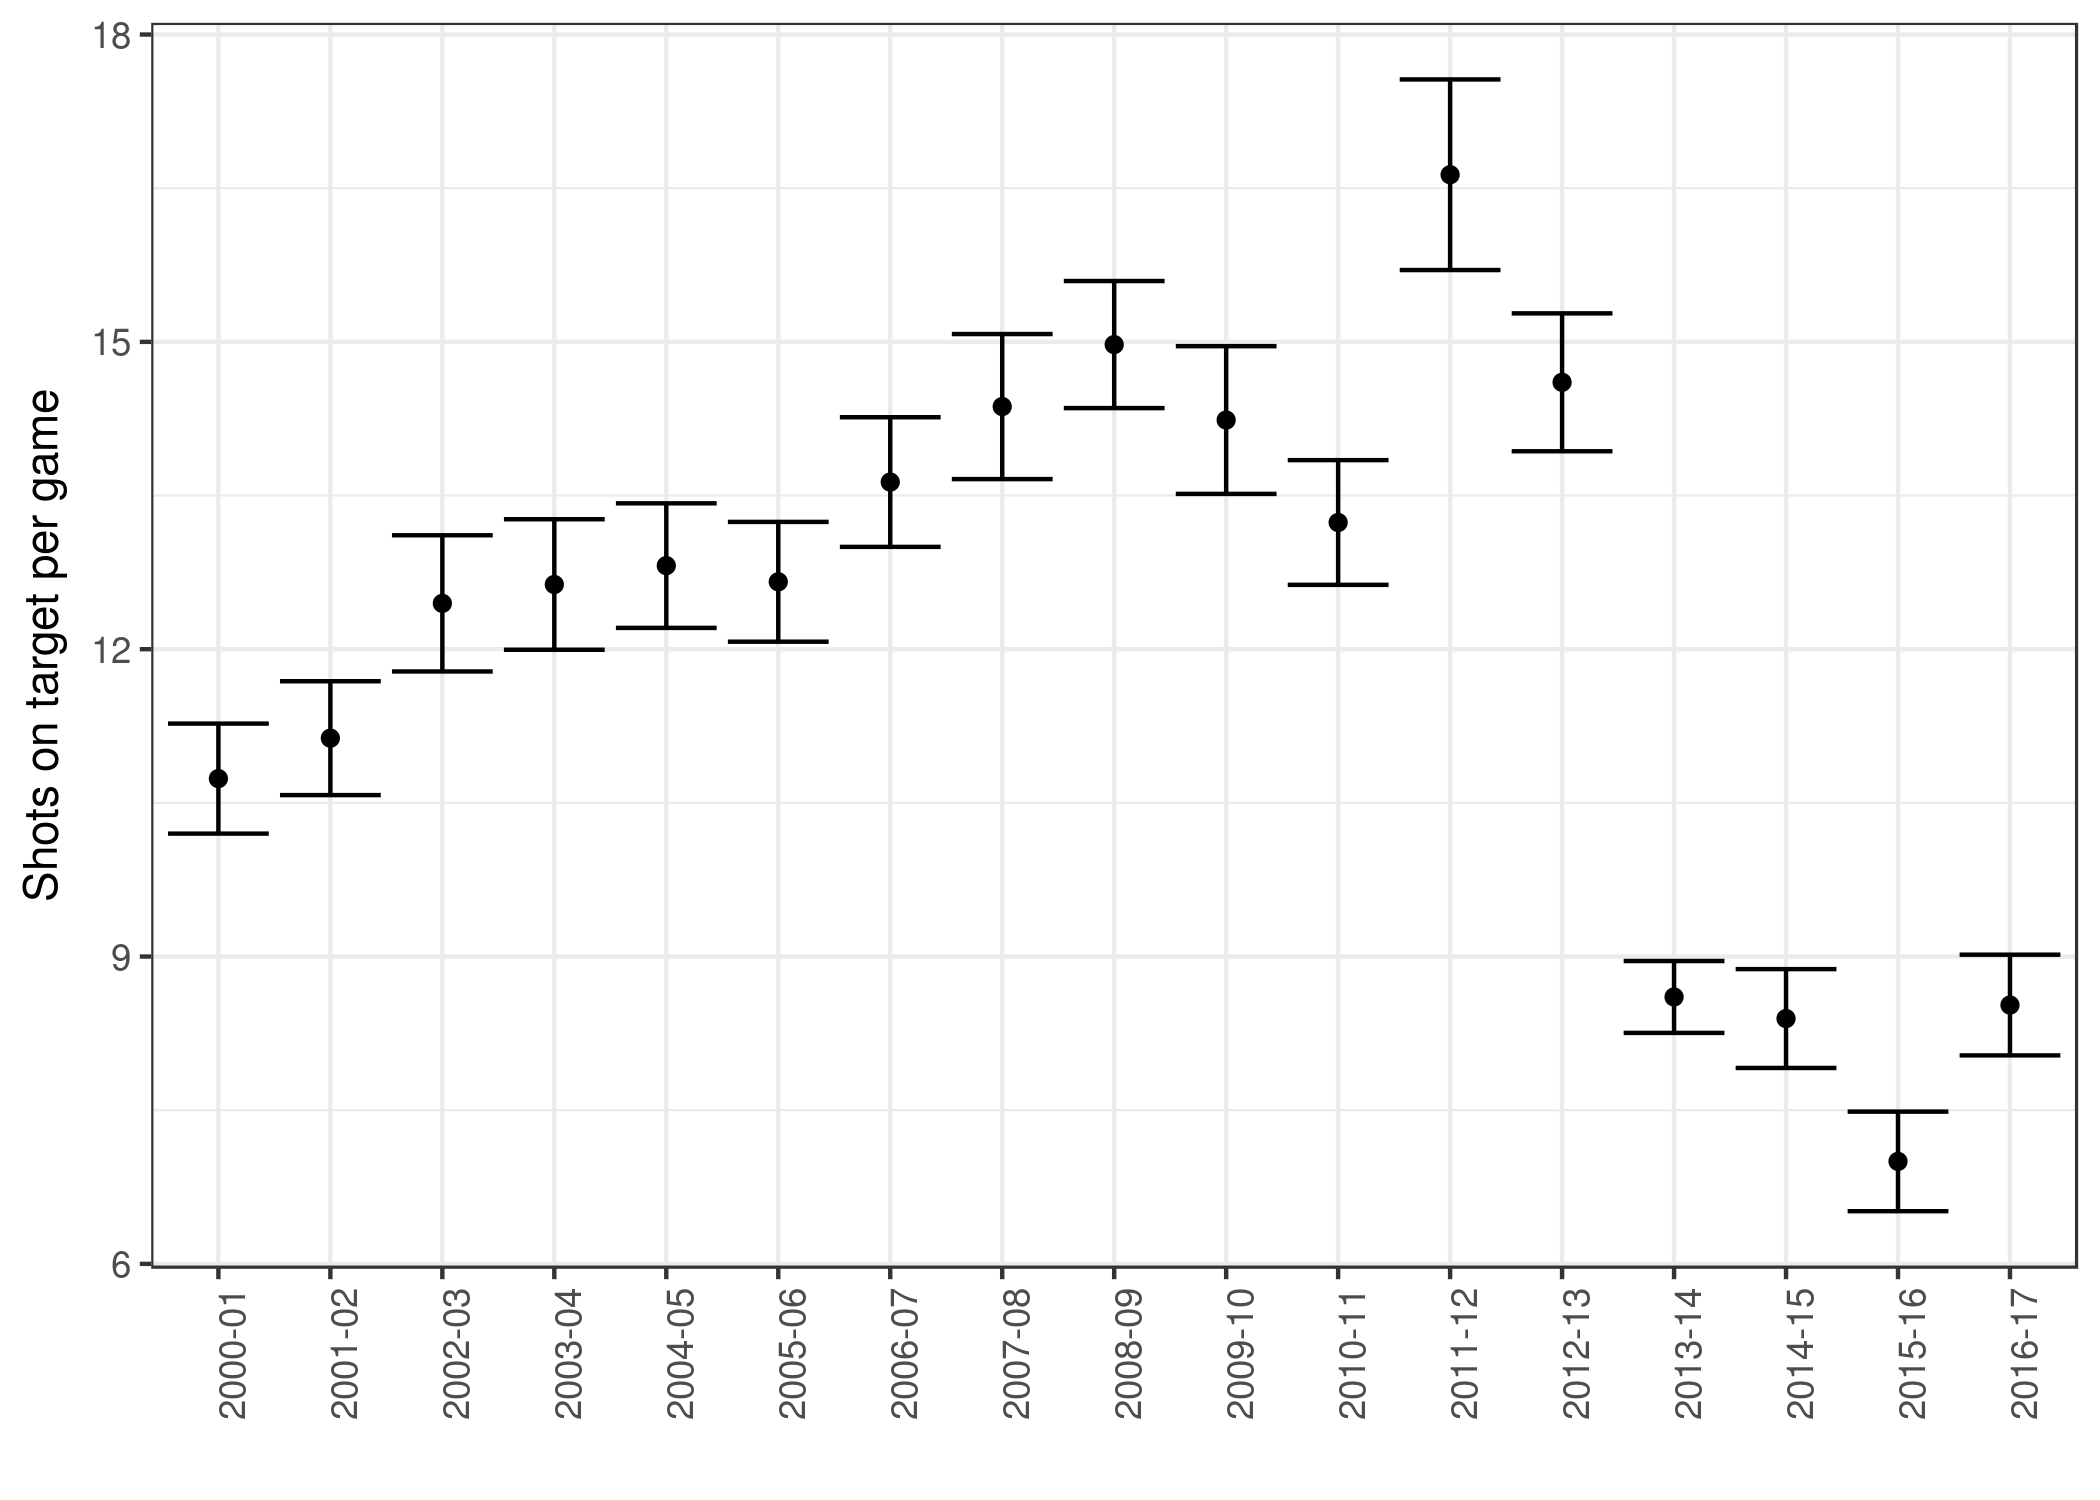
Shots on target tells a different story, showing a real difference between United over the last 4 seasons and their more dominant period between 2000-01 to 2012-13.
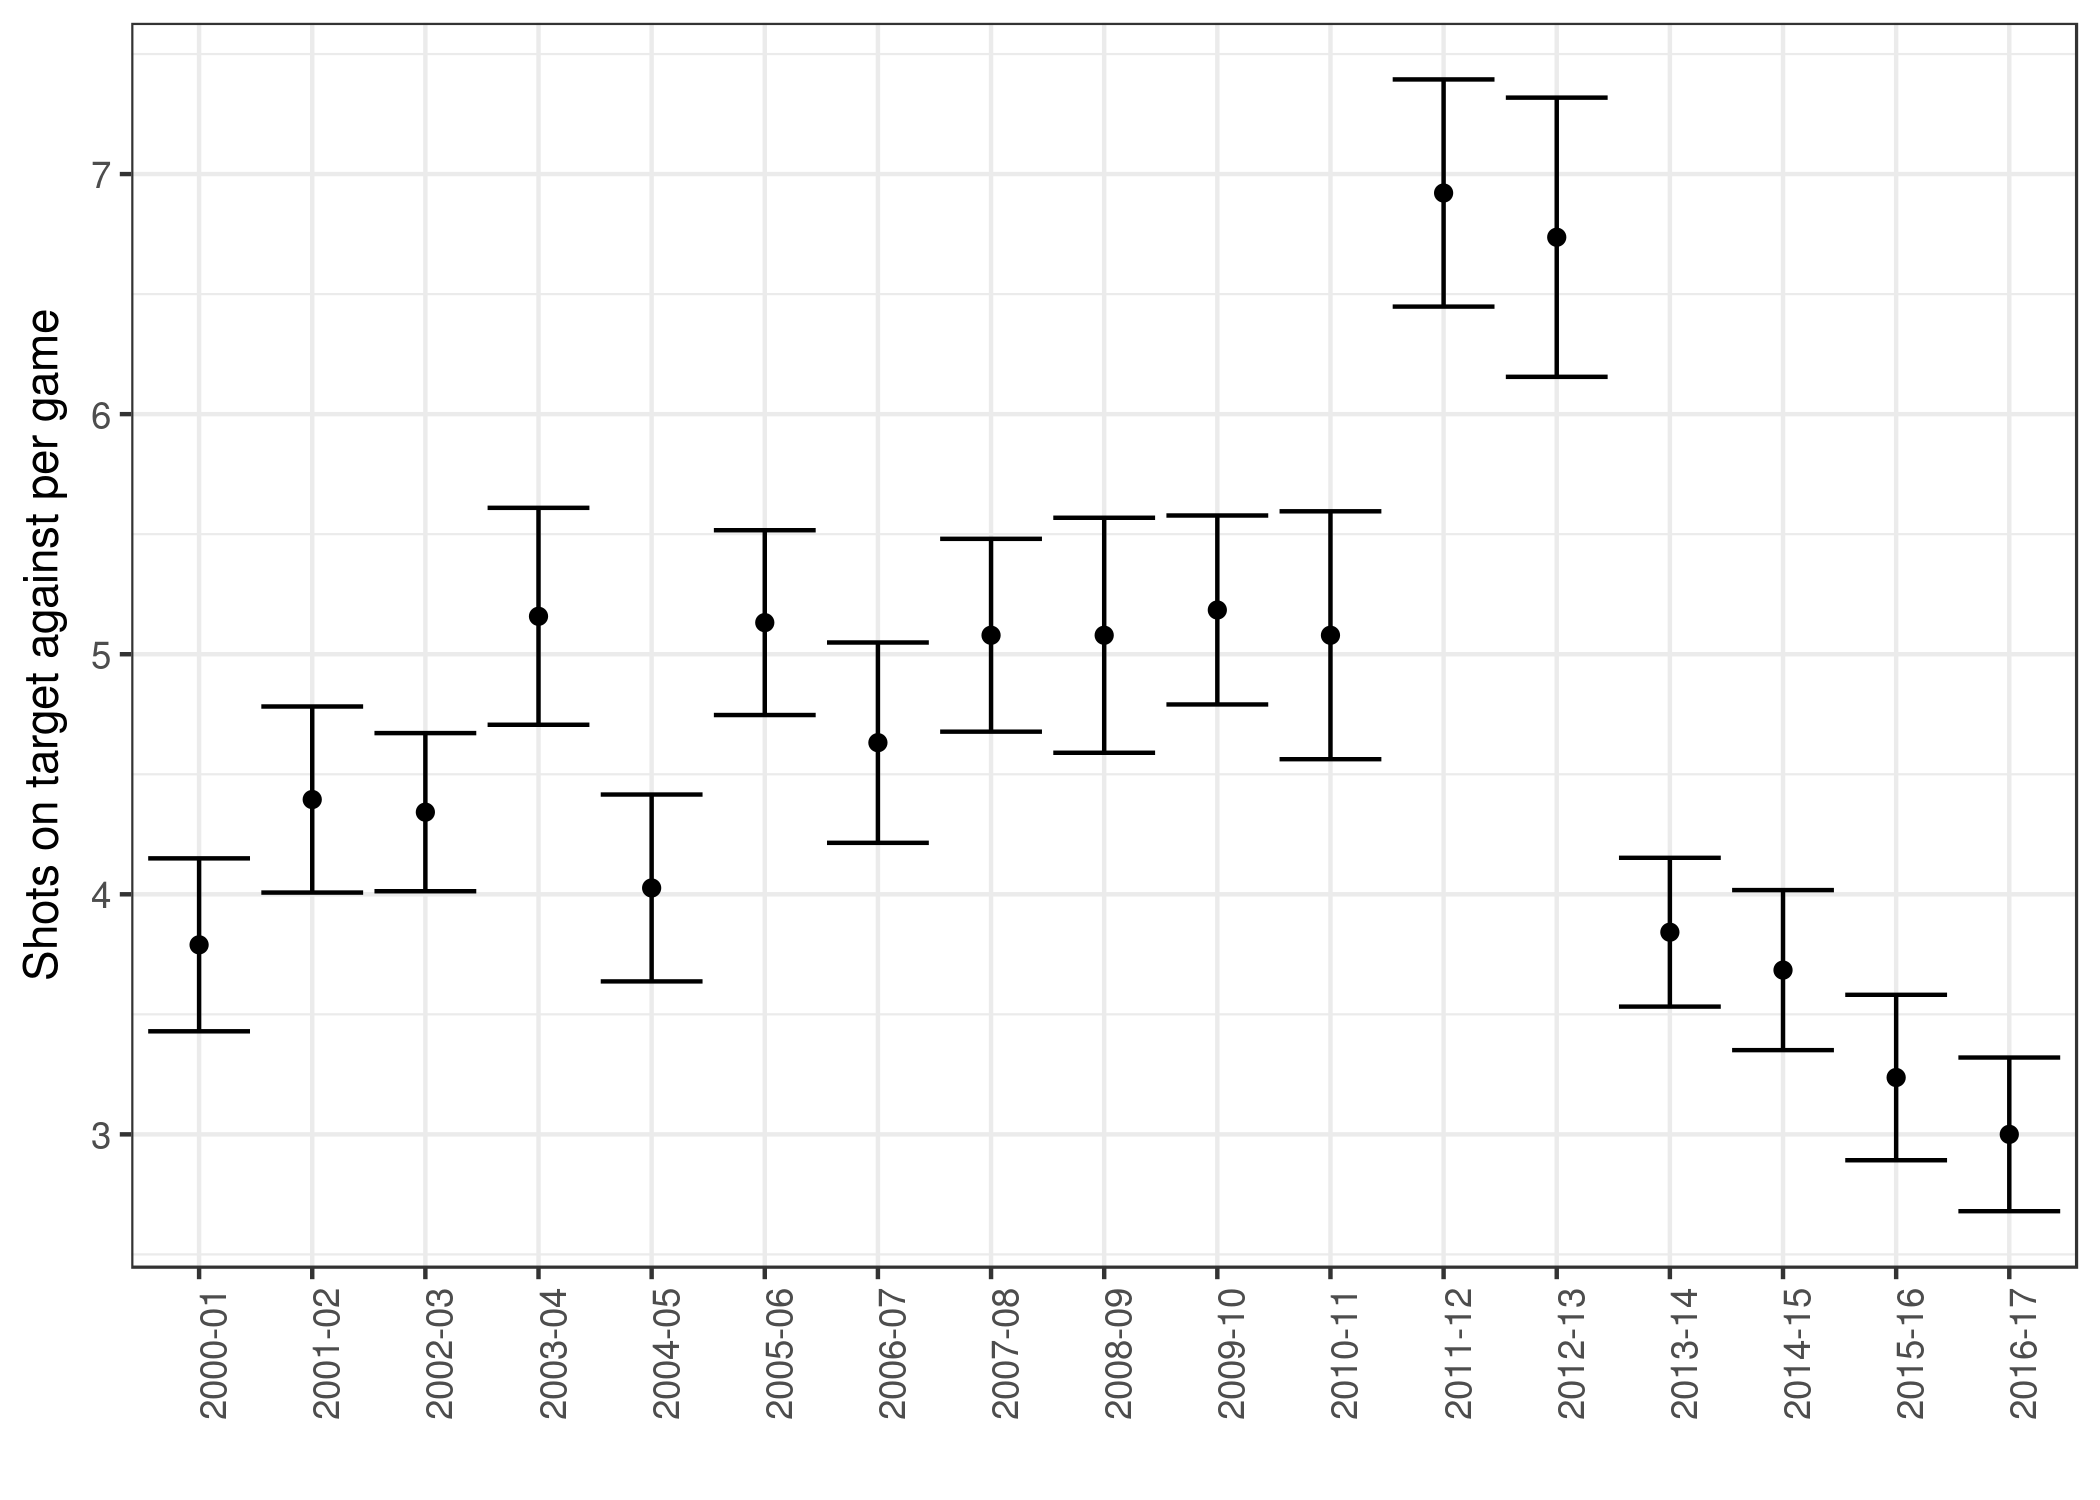
Again though, this seems to work both ways - United have also afforded their opposition fewer goalscoring opportunities in the last 4 seasons.
Although expanding our ‘excitement score’ from total goals per game to total shots per game, these 4 seasons look much less exciting for the neutral.
‘Net goalscoring opportunities’
I want to do something more interesting with our shots data. I’m interested in whether this so-called ‘negative football’ – creating less but also stifling the opposition – works or not. Let’s make a metric called ‘net goalscoring opportunities’: simply the difference between chances created and chances conceded. Here’s the data for United’s net shots per game over previous seasons (I won’t show the data for shots on target but it looks very similar).
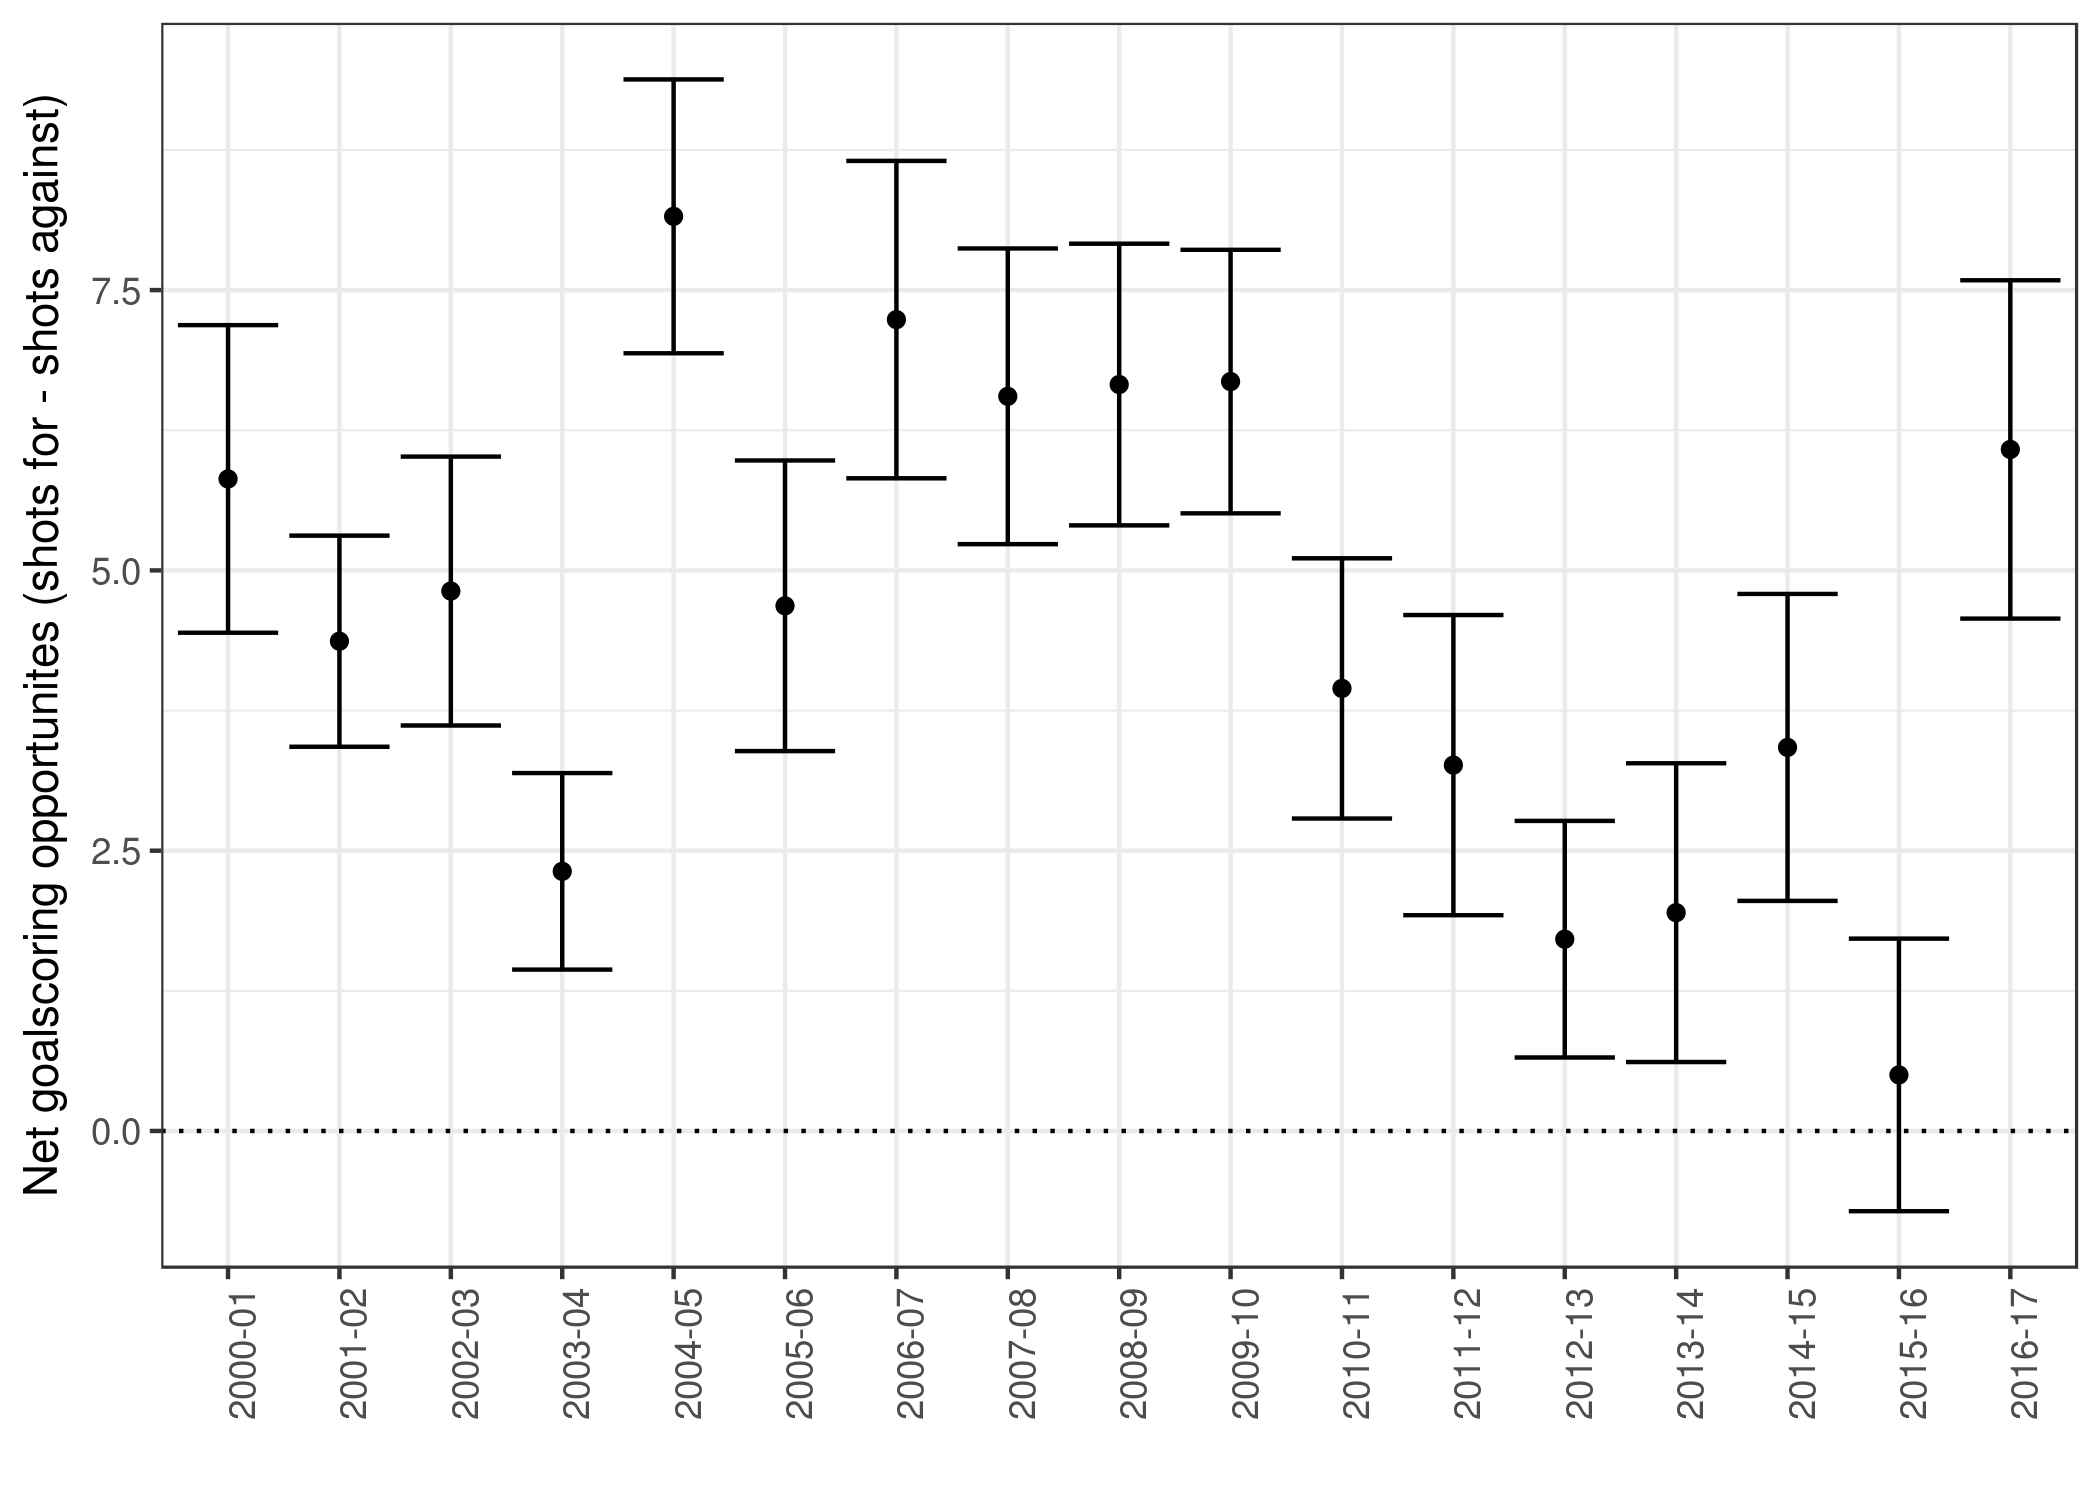
Last season was by far the worst, entering the negative in some games, but this season’s United look back to old form. I’m not sure how useful this number is in measuring success; United’s 2nd lowest score came in the 2012-13 season yet they won the league..
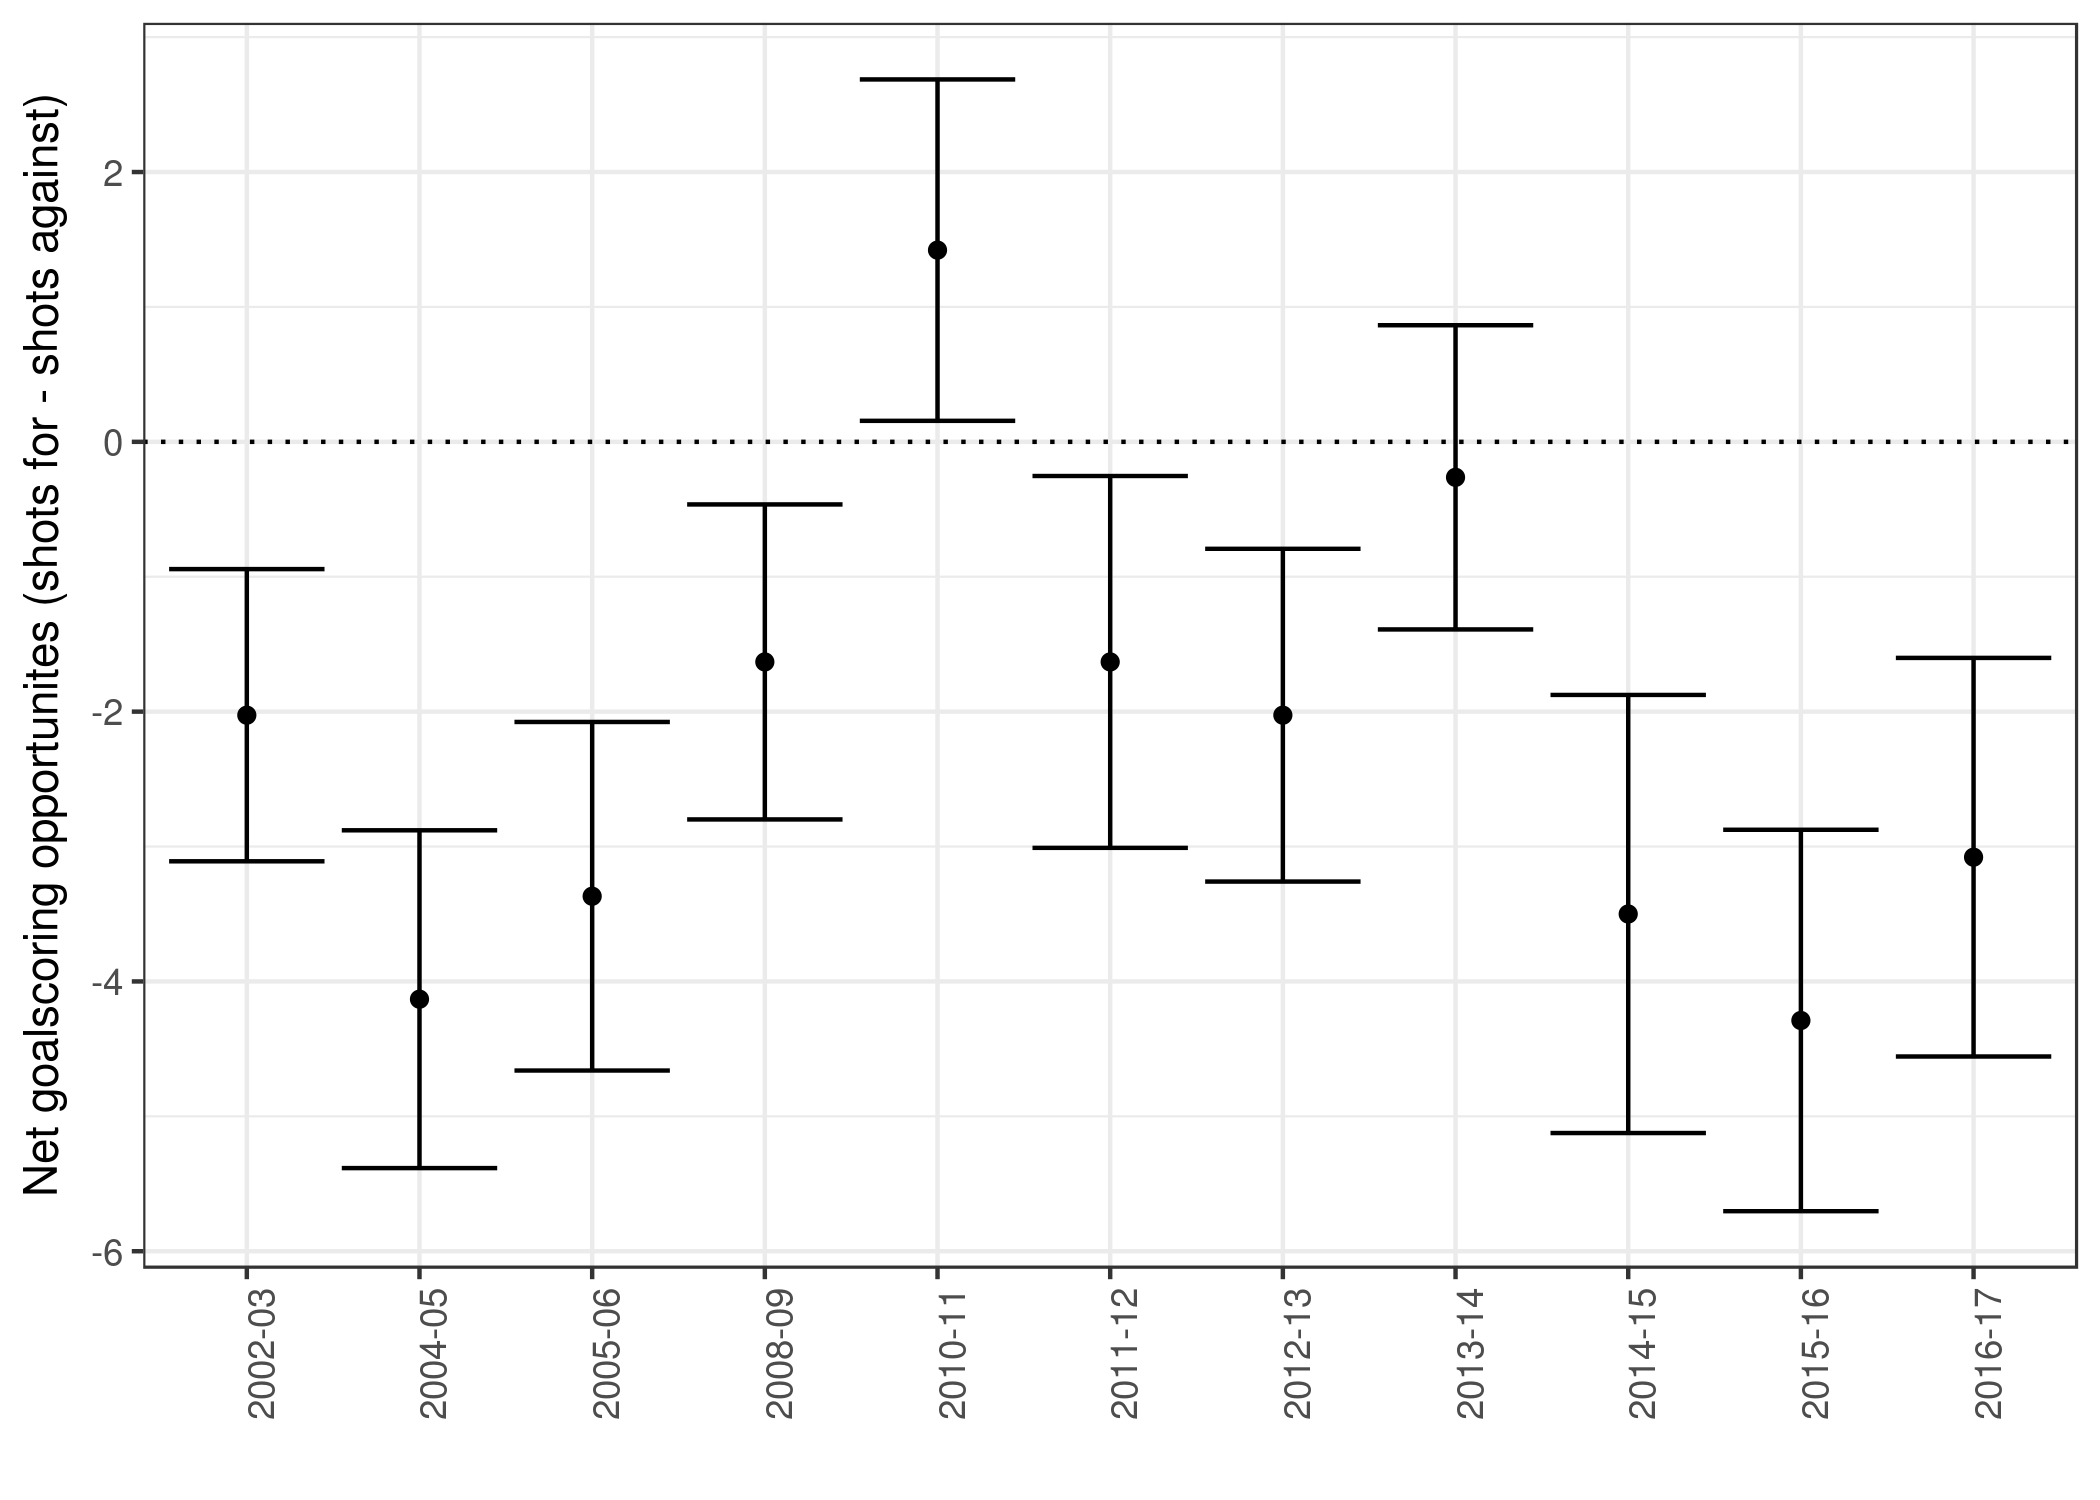
Let’s investigate the value of the metric further by trying to find a team we’d expect to have a net goalscoring opportunity. A team that’s got a few PL seasons under their belt but spent much time in the bottom half of the league maybe. West Brom are the first team that come to mind (sorry again, Baggies).
This follows what we expected. How about seeing whether net goalscoring opportunities (I’m refusing to acronym-ise this) is a decent predictor of results by plotting it against final league position. We need to dip back into engsoccerdata to make league tables for each season, and use a touch of wizardry to merge these dataframes together as they contain different team name variations (e.g. ‘Man City’ vs. ‘Manchester City’)
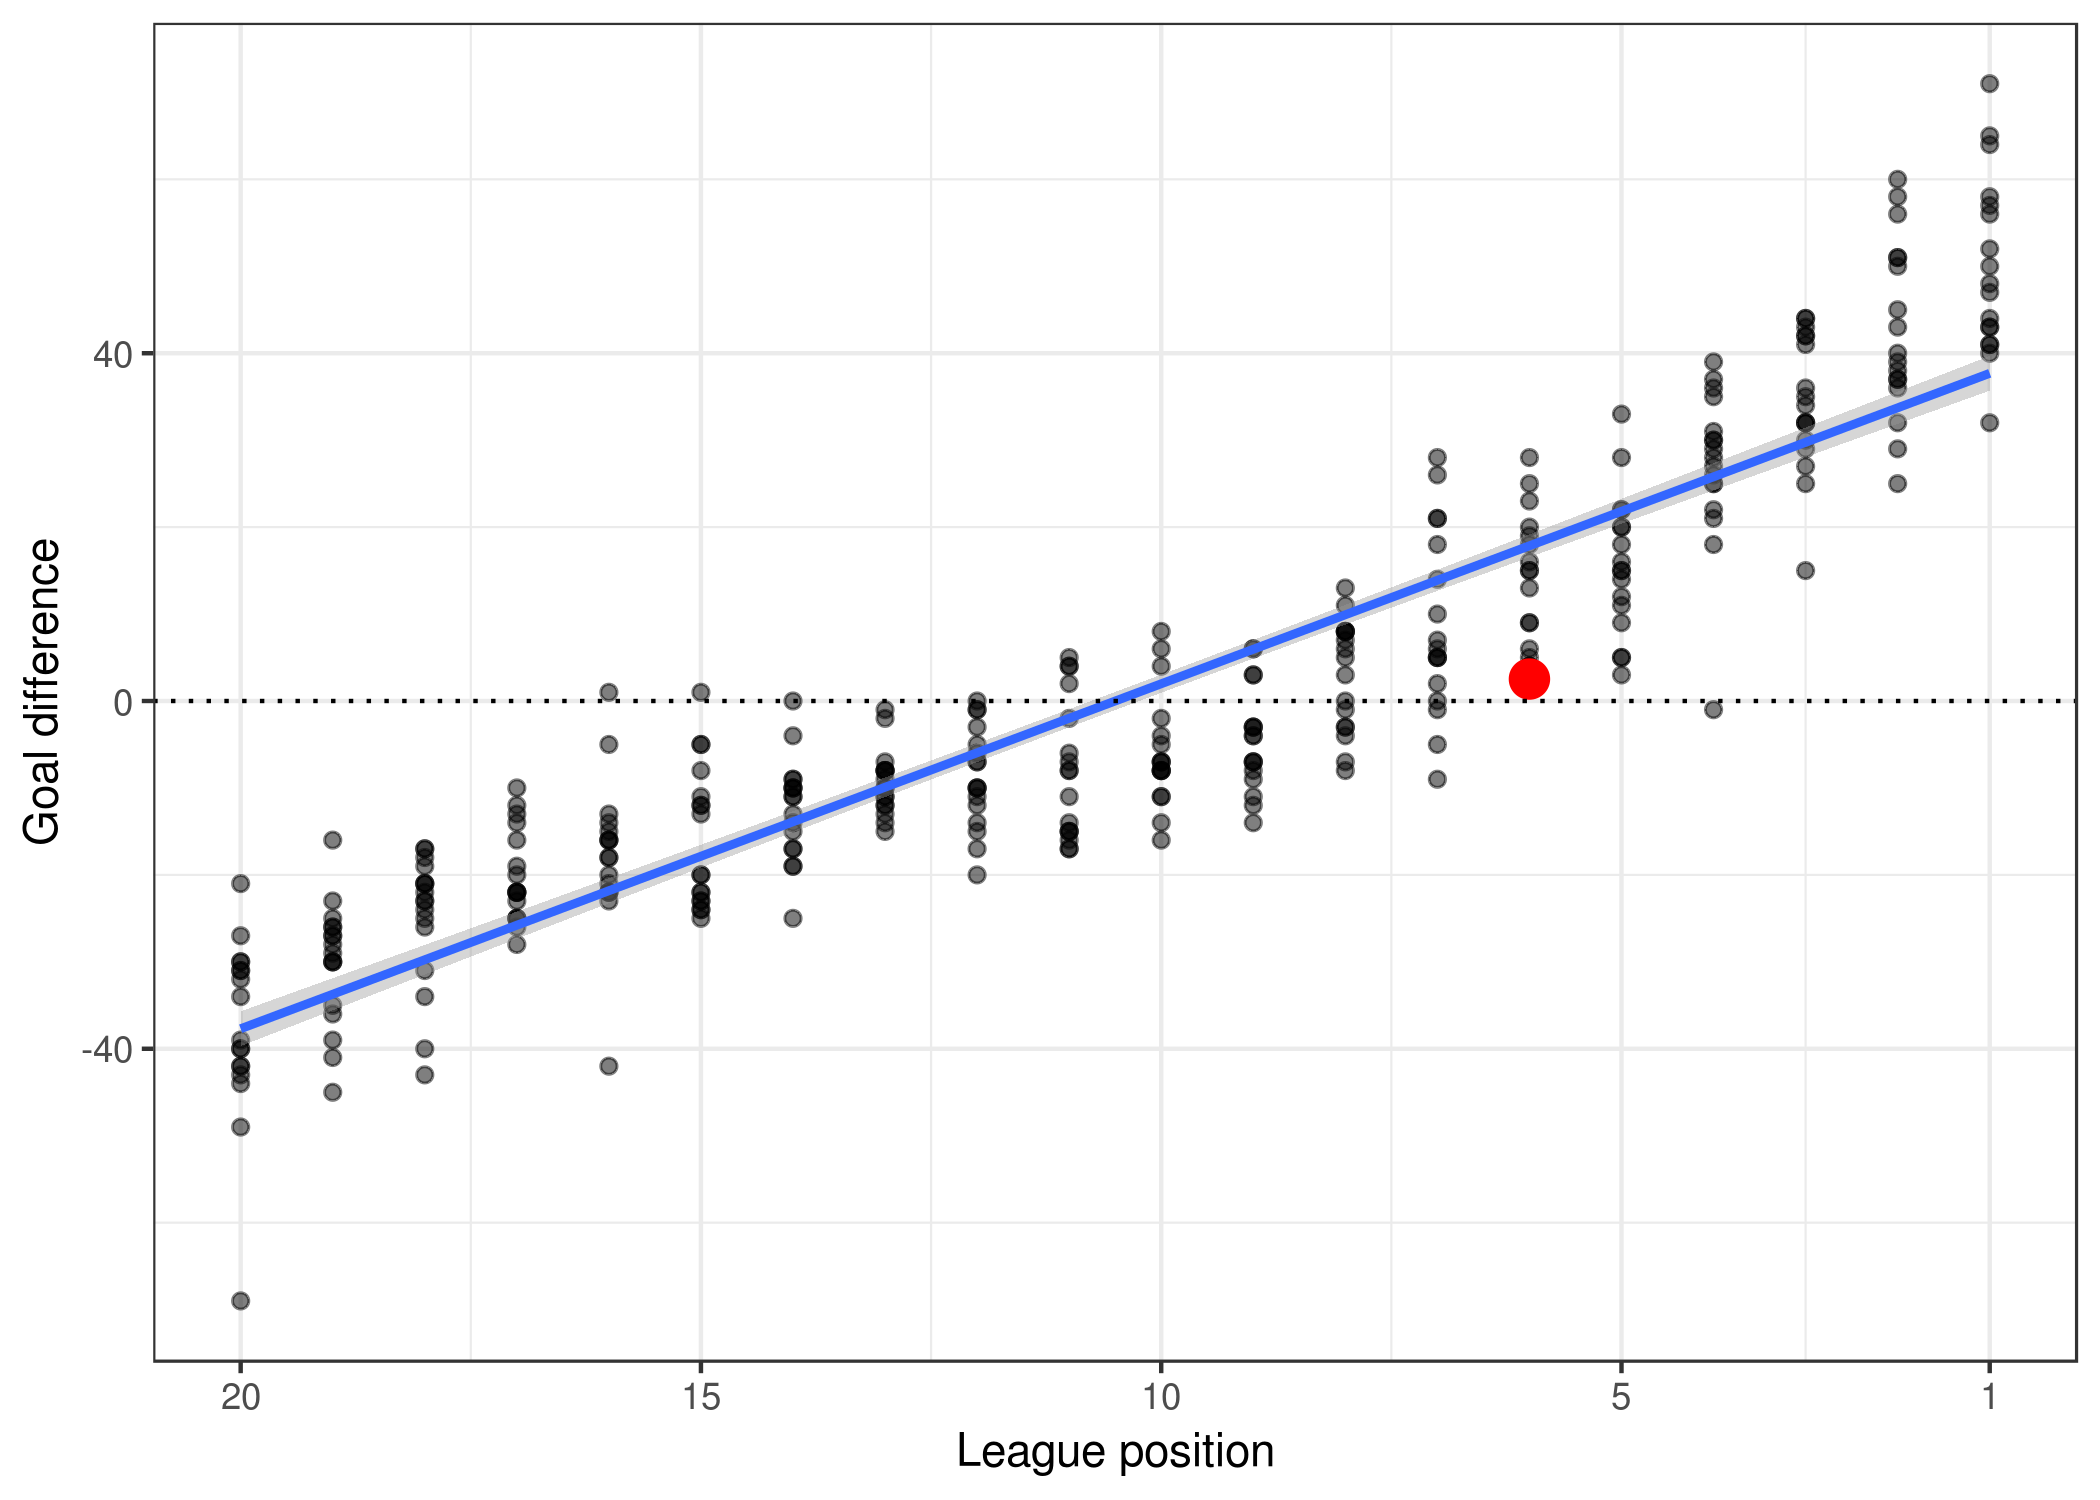
Let’s plot it: net total shots vs. league position…
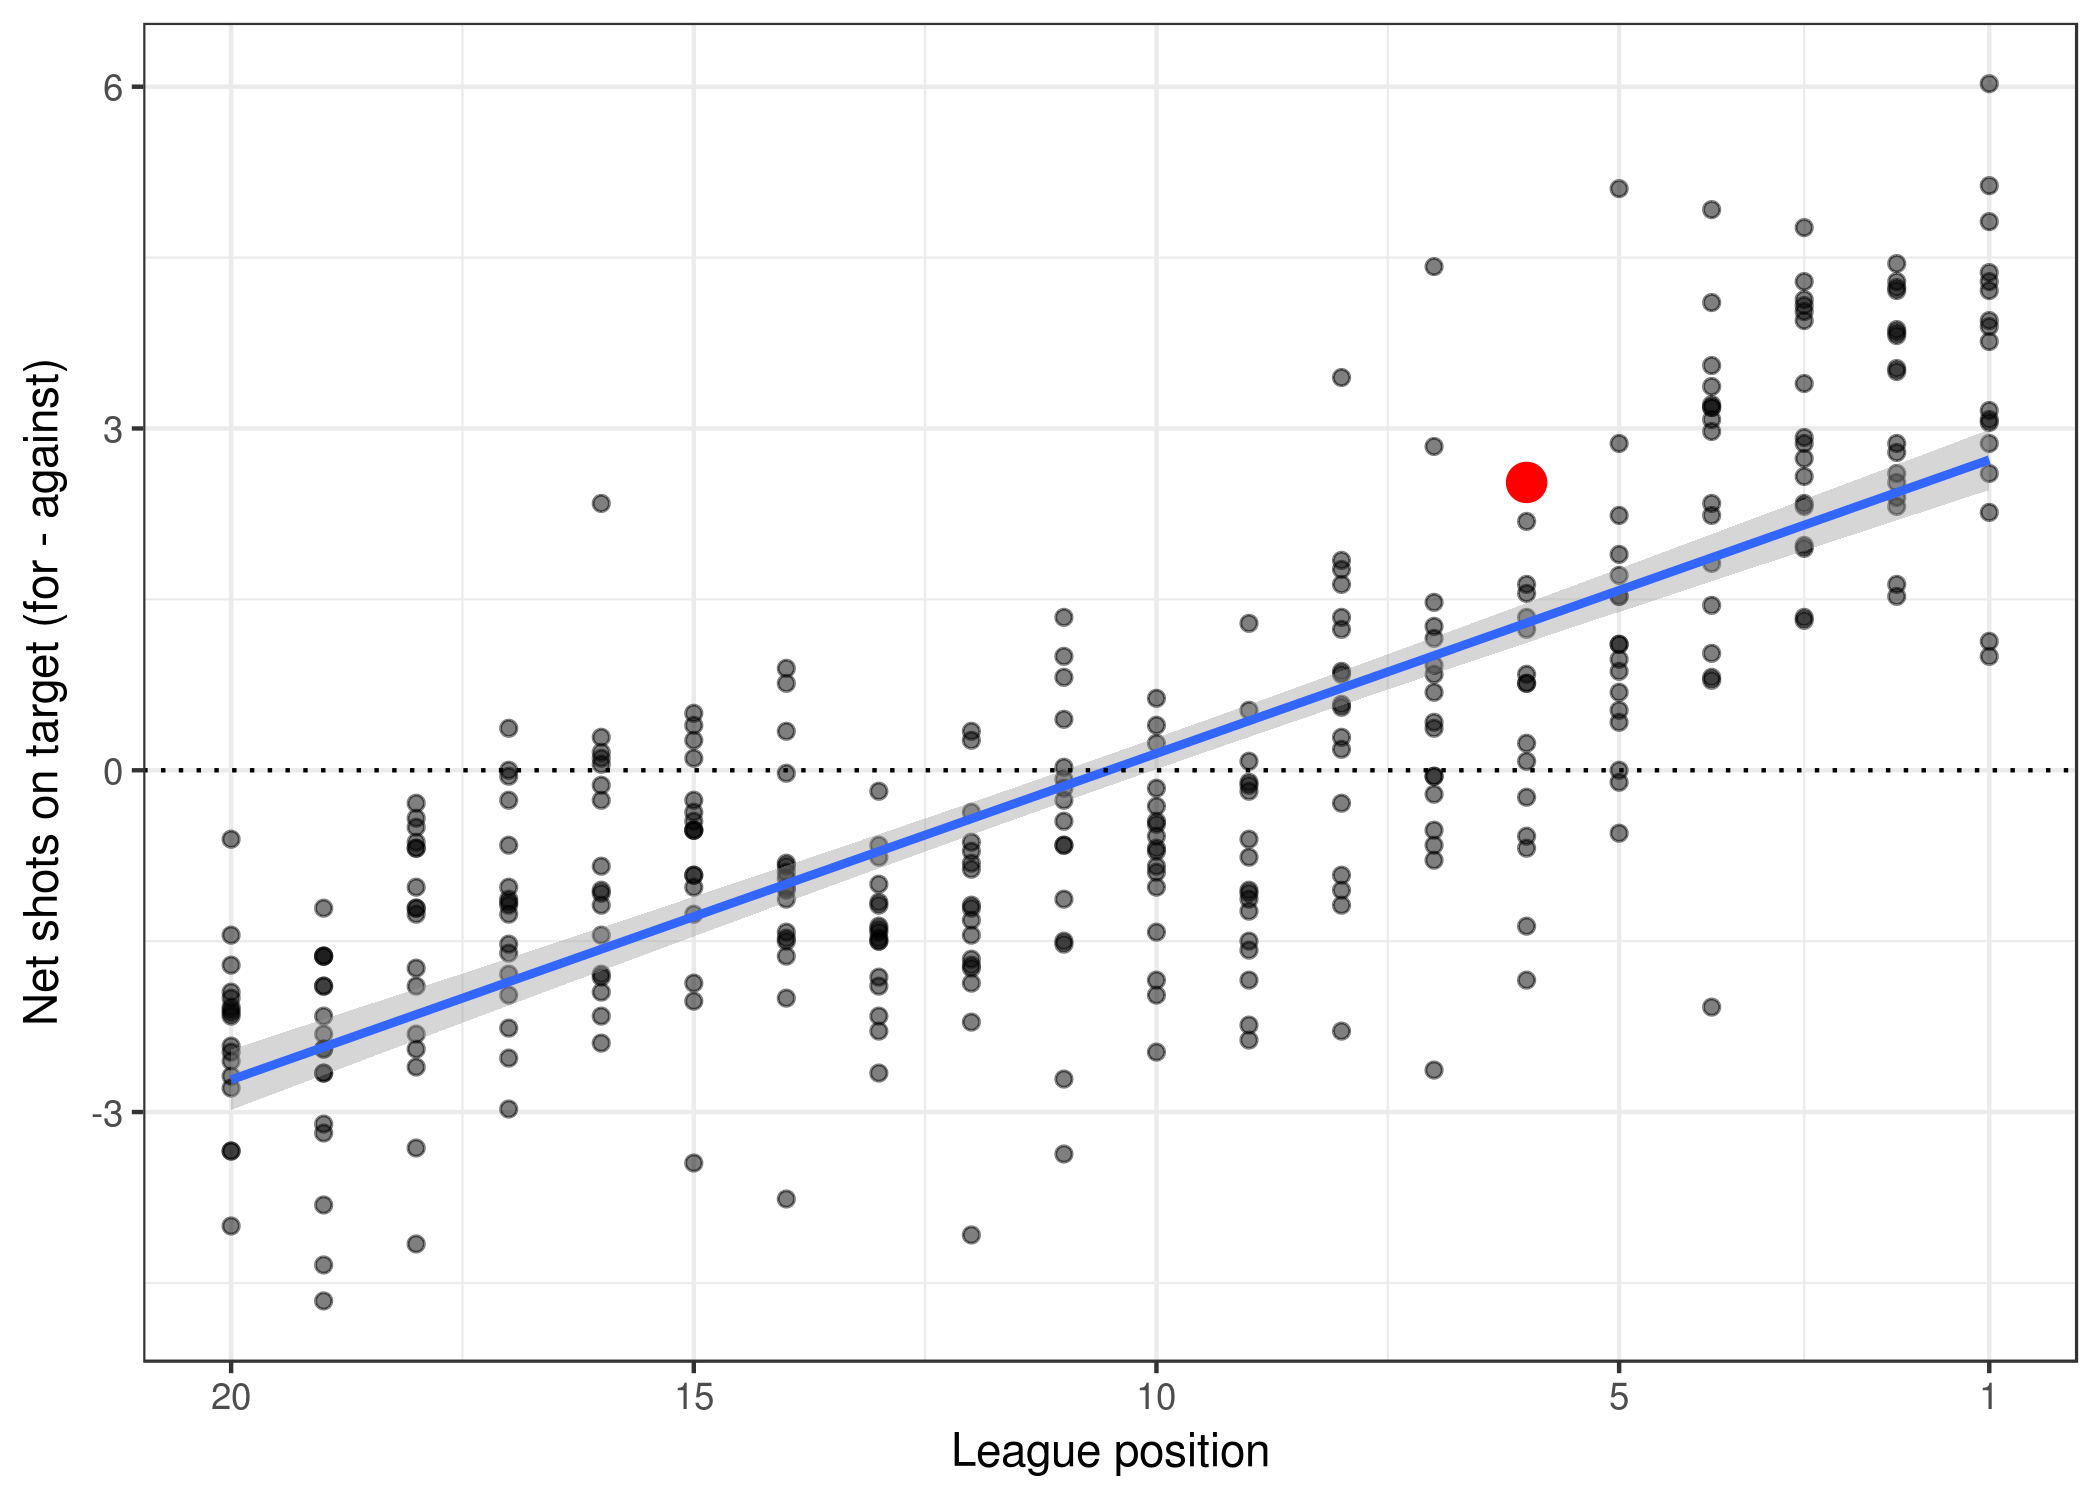
It looks like a decent metric of success. In both cases, the line of best fit crosses the zero line at around 10-11th position, exactly where we’d have expected when trying to separate the top and bottom teams.
Not forgetting Man United, I’ve added their point for this season in red. They’re placed exactly as expected considering their net shots but actually have the best net shots on target of any team finishing in 6th (+2.6 SoT per game) and could even be considered unlucky: team’s have won the league with similar figures in other seasons.
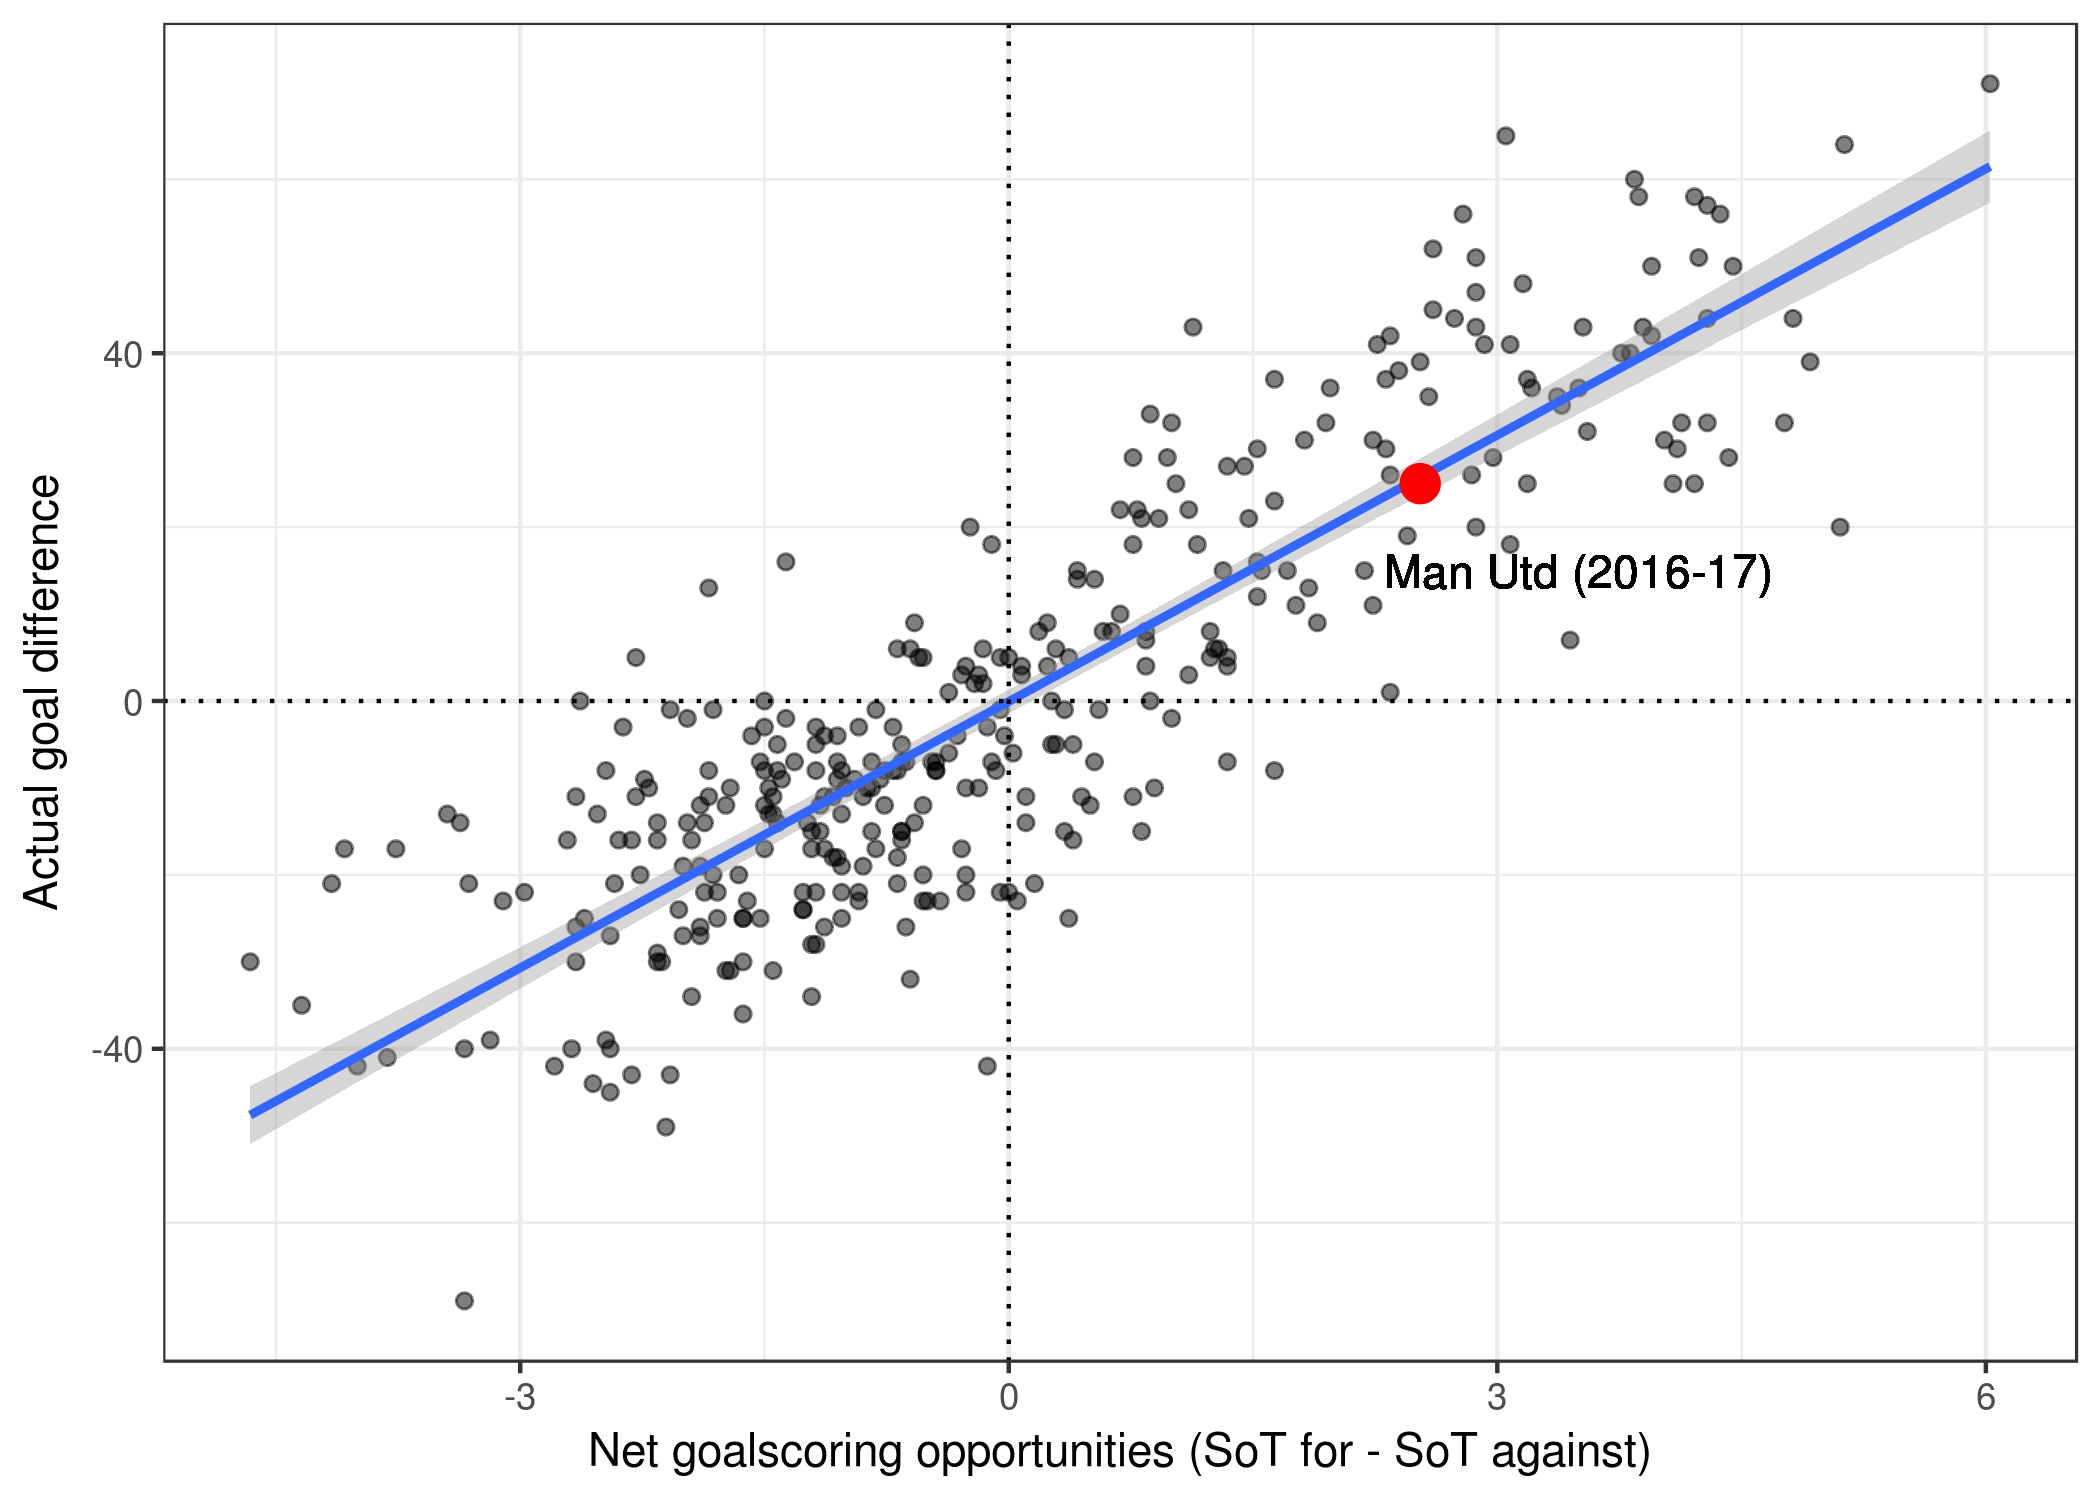
But hang on; this pattern is almost identical to what we see with goal difference…
…and this similarity might be due to a strong correlation between net goalscoring opportunites and actual goal difference. Not that that should be too surprising.
Efficiency or luck?
I’m not convinced our ‘net goalscoring opportunites metric offers any advantage over straight-up goal difference given how correlated the two are, although it’s possible the distance of an individual point from the line of best fit could tell us something worthwhile. Teams above the line have a better goal difference than expected considering the balance between the number of goalscoring opportunities they create and the concede. This seems to be sort of measure of ‘effectiveness’ (I’m not sure what to better call it): how good teams are at converting chances into goals, and how well they deal with opponents’ chances. Teams falling above the line might be great at burying their chances and/or have a great shot-stopper in goal.
It might also be aruged that the deviations from this line of best fit are often considered good luck or bad luck. Teams below the line convert a lower proportion of their shots into goals than expected and/or concede more goals than expected considering the number of shots they face.
Let’s just naively call it ‘luck’ for now seeming as we don’t know much yet. We’ll measure it as the residual of a point, i.e. its distance from a linear regression fitted to the above data; negative scores are ‘unlucky’ teams which fall below the line and vice versa.
Here’s the highest 5 / lowest 5:
##     Season              team      net_S    net_SoT Pos  gf ga  gd  season
## 1     2009    Wigan Athletic  0.7105263 -0.1315789  16  37 79 -42 2009-10
## 2     2007      Derby County -5.7368421 -3.3421053  20  20 89 -69 2007-08
## 3     2012 Tottenham Hotspur  7.3947368  5.1052632   5  66 46  20 2012-13
## 4     2005        Portsmouth  0.3947368  0.3684211  17  37 62 -25 2005-06
## 5     2011         Liverpool  6.2105263  3.4473684   8  47 40   7 2011-12
## 335   2006           Reading -3.6052632 -2.2894737   8  52 47   5 2006-07
## 336   2006           Everton -2.8157895 -1.3684211   6  52 36  16 2006-07
## 337   2012 Manchester United  1.7105263  1.1315789   1  86 43  43 2012-13
## 338   2009       Aston Villa -2.1842105 -1.8421053   6  52 39  13 2009-10
## 339   2013   Manchester City  8.3157895  3.0526316   1 102 37  65 2013-14
##          luck
## 1   -40.59618
## 2   -34.81080
## 3   -32.07398
## 4   -28.70210
## 5   -28.14382
## 335  28.43990
## 336  30.03425
## 337  31.50465
## 338  31.87144
## 339  33.88717
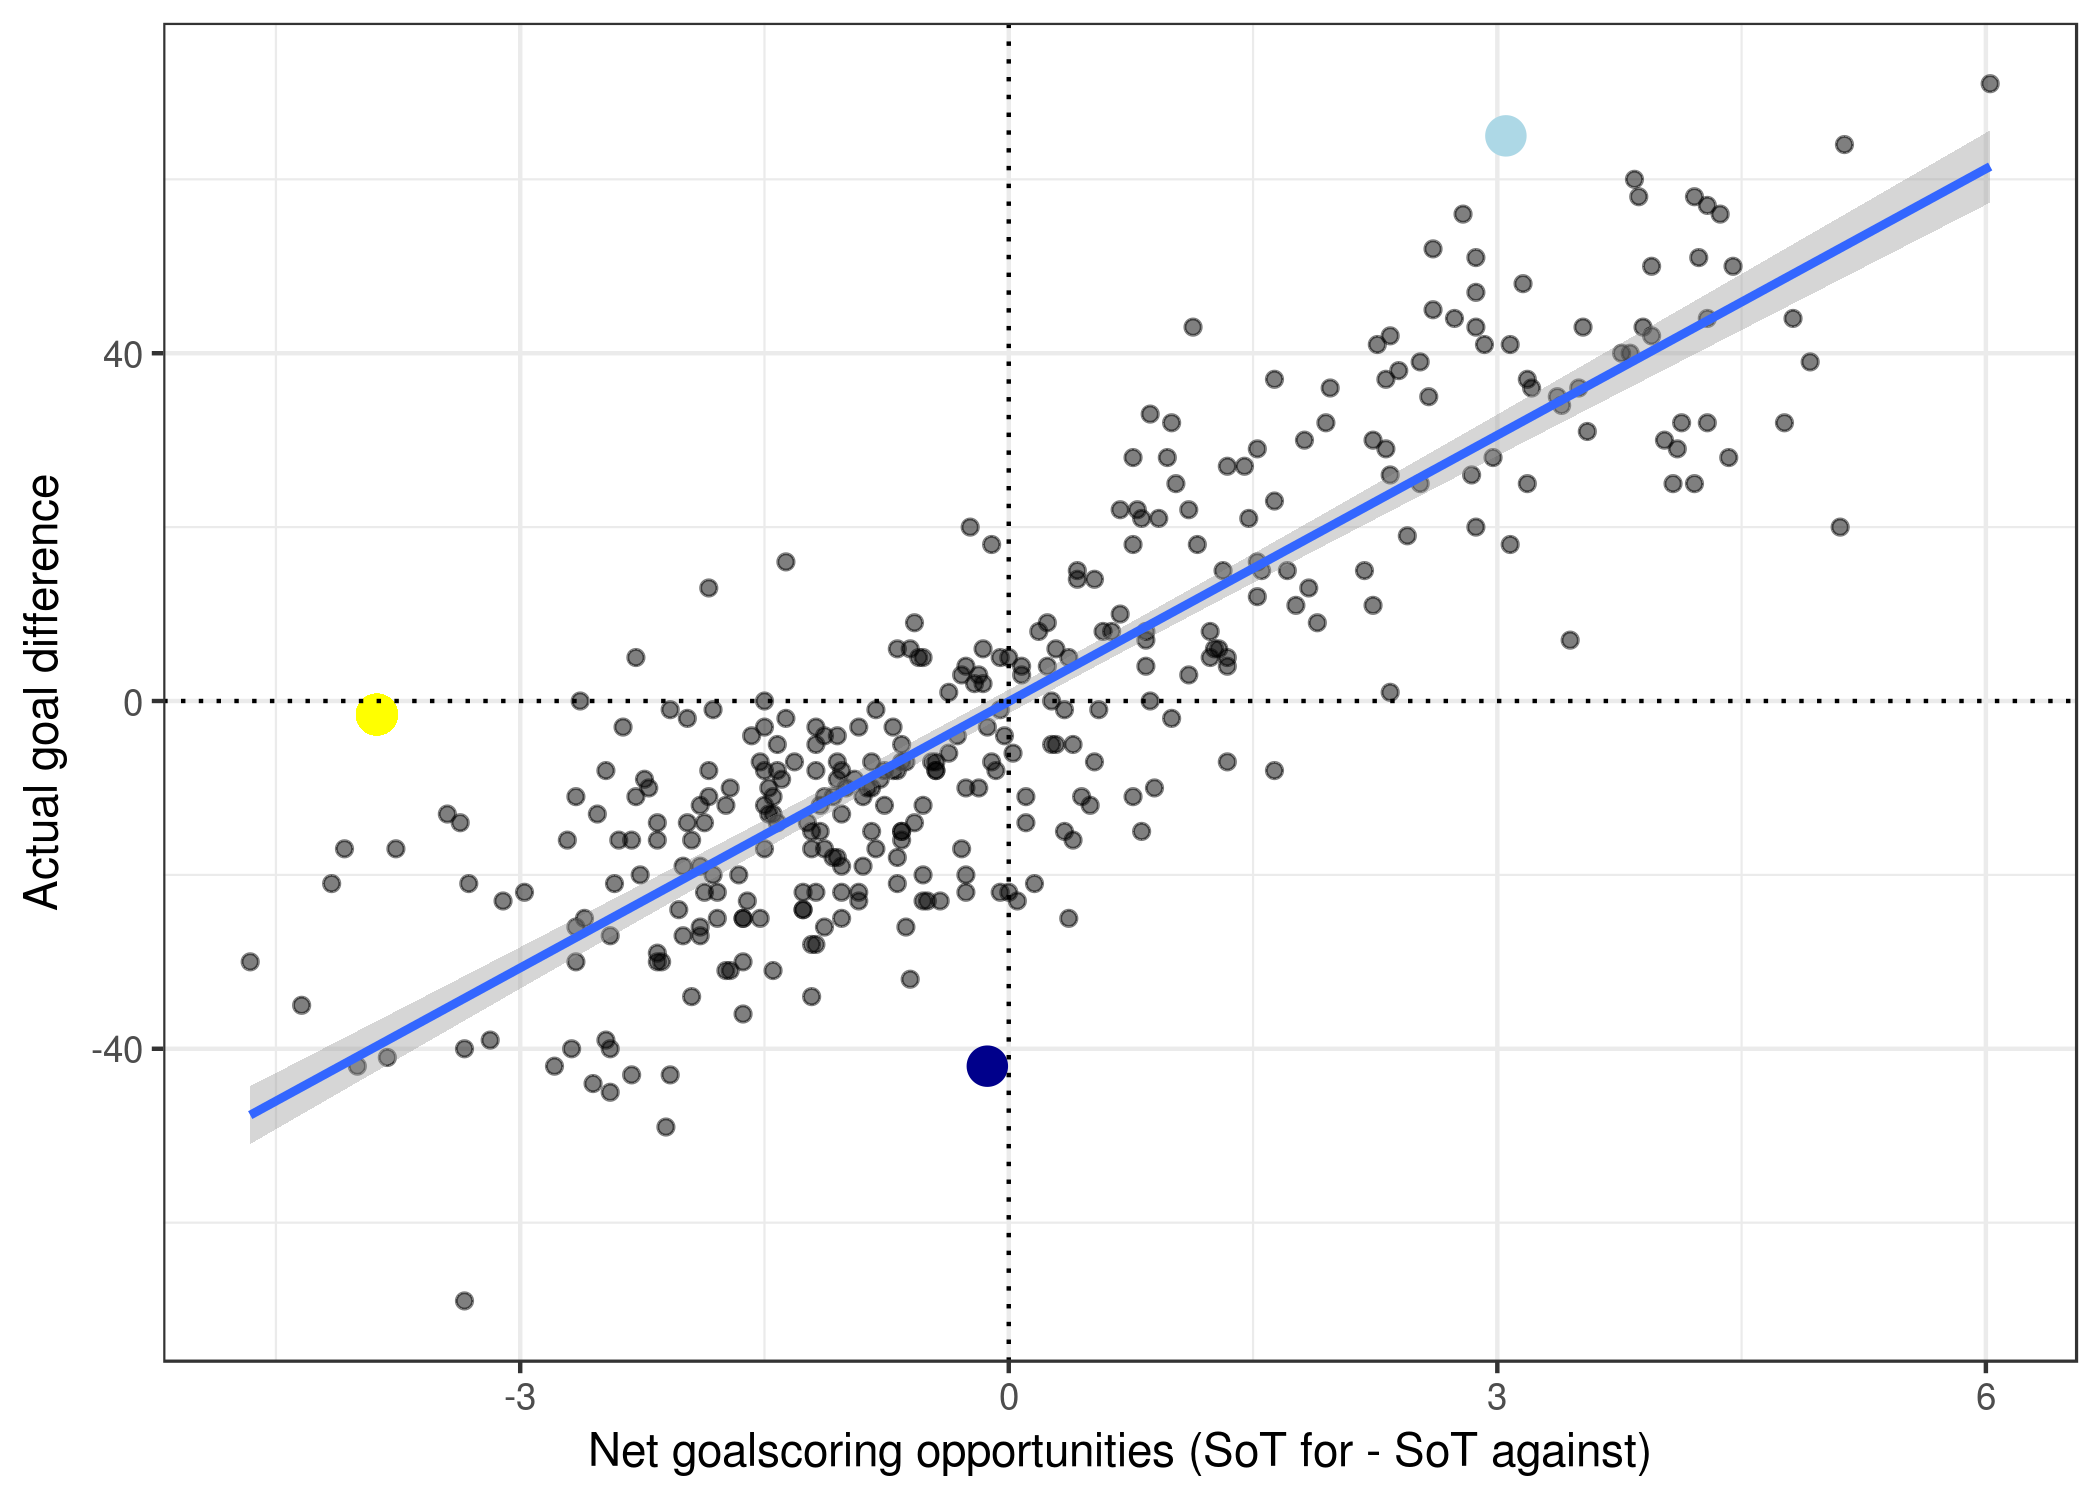
Interestingly, the first team that came to mind was Leicester this season prior to Ranieri’s departure. I remember hearing a stat that they’d been unlucky in the season so far (although I can’t recall how this was quantified) and were due a good run, and the next week they went and beat Liverpool 3-1 (typical). But taking their position from the results before game (yellow point, below), they actually rank above the line.
The unluckiest and/or most wasteful and/or most leaky defensive season in PL history was had by Wigan in 2009-10, who fall way below the line (dark blue). And the flukiest and/or most clinical and/or defensive rock of a season was had by Man City in 2013-14 (sky blue). Not sure this stat makes me feel any better about that season whatever it means, but I’m sure it’s a nice bonus for any United fans that are still reading.
In conclusion…
I’ll wrap this post up now. It’s been another loosely-directed paddle in the shallows of the bottomless sea that is football statistics, but hopefully another example of what can be readily done with freely-available datasets, open-source software, and the art of creating probably-useless metrics that may or may not mean anything.
With regards to United, the stats do support the concesus that they’ve had a boring season and more generally appear to have been in a rather boring transitional period over the last 4 seasons. Obviously this isn’t a new thing under Mourinho then, but as a Red that doesn’t think he’ll ever do the business at United, I say long may he reign. Or maybe I just love to hate the man.
Coming soon is a thrillogy of posts on ‘Robin Hood’ teams: those that take points from the top teams and redistribute them to the bottom, with an obvious focus on Liverpool this season, who are unbeaten against the top 6 yet have been woeful against the bottom half teams. I might take a more in-depth look at luck in a future post too; I’m particularly interested in finding a metric that can be used as a predictive tool, i.e. what team’s recent form may just be down to bad luck and be worth a punt in the bookies?
Footnote
What was the most exciting nil-nil ever? i.e. the game with the highest number of shots / shots on target that somehow ended goalless?
Funnily enough, Man United gave us The Most Exciting Nil-Nil Of All-Time (well, of the period 2000-01 - present) against Burnley at Old Trafford this season. That is if we go by total number of shots – there were 44 shots in this game, 37 of those taken by United!
##         Date   HomeTeam    AwayTeam shots home away
## 1 2016-10-29 Man United     Burnley    44   37    7
## 2 2001-03-03   Coventry     Chelsea    41   17   24
## 3 2014-01-29    Chelsea    West Ham    40   39    1
## 4 2009-12-26 Birmingham     Chelsea    38   11   27
## 5 2010-02-06  Tottenham Aston Villa    38   28   10
Or if clinical excitement is more your thing, the title of Most-Shots-On-Target-In-A-Nil-Nil goes to the 25 SoT recorded in the game between Spurs and Man City at White Hart Lane two seasons ago; Spurs: 18, City: 7.
##         Date    HomeTeam  AwayTeam SoT home away
## 1 2010-08-14   Tottenham  Man City  25   18    7
## 2 2004-01-07 Southampton Leicester  22   14    8
## 3 2004-10-02 Southampton  Man City  22   11   11
## 4 2012-11-25     Swansea Liverpool  22    8   14
## 5 2001-03-03    Coventry   Chelsea  21   10   11