Liverpool’s 2016-17 season was a bit of a Jekyll & Hyde one. They went unbeaten against the other teams in the top 6 and sat comfortably on top of the intra-top 6 league table with 2 points per game (ppg).
##                team GP W D L gf ga gd Pts ppg
## 1         Liverpool 10 5 5 0 16  9  7  20 2.0
## 2           Chelsea 10 5 1 4 16 14  2  16 1.6
## 3 Tottenham Hotspur 10 4 3 3 13 10  3  15 1.5
## 4   Manchester City 10 2 4 4 11 15 -4  10 1.0
## 5 Manchester United 10 2 4 4  7 12 -5  10 1.0
## 6           Arsenal 10 2 3 5 15 18 -3   9 0.9
Yet they also suffered 6 league defeats, all against teams finishing 9th or lower in the league: Burnley (16th), Bournemouth (9th), Swansea (15th), Hull (18th), Leicester (12th), and Crystal Palace (14th). This lead to several people dubbing Liverpool the ‘Robin Hood’ of the football world: taking points from the rich and giving them to the poor.
Nothing more than a throwaway joke maybe, but as a Liverpool fan I couldn’t help but wonder if there isn’t something painfully true at its heart. Liverpool had a similar season in 2008-09, suffering only two defeats all season and averaging 2.2 ppg against the rest of the season’s top 6 (I can’t bring myself to not mention double wins over Chelsea and Man Utd which included a 4-1 win at Old Trafford), yet costly dropped points against Wigan, Stoke, Hull, and Fulham saw them finish 4 points adrift of eventual winners United.
The aims of this two-part post are:
- To develop a metric for identifying ‘Robin Hood’ teams; we could call it
Robin Hood-nessbut I prefer the Iain Dowie-approvedHoodability - To test whether Liverpool really were a Robin Hood team this season and whether they consistently show symptoms of Hoodability in previous seasons
- To find other Robin Hood teams and rank them by their Hoodability
- To gauge what impact (if any) Hoodabiity has on overall team performance for the season
Let’s fire up R with our trusty engsoccerdata package and a few friends.
First, let’s write the code to make the intra-top 6 table above showing Liverpool on top with 2 ppg.
##                team GP W D L gf ga gd Pts ppg
## 1         Liverpool 10 5 5 0 16  9  7  20 2.0
## 2           Chelsea 10 5 1 4 16 14  2  16 1.6
## 3 Tottenham Hotspur 10 4 3 3 13 10  3  15 1.5
## 4   Manchester City 10 2 4 4 11 15 -4  10 1.0
## 5 Manchester United 10 2 4 4  7 12 -5  10 1.0
## 6           Arsenal 10 2 3 5 15 18 -3   9 0.9
Now, let’s make a similar hypothetical table with the top 6, but this time showing their performance against the bottom 6 teams this season.
##                team GP  W D L gf ga gd Pts  ppg
## 1 Tottenham Hotspur 12 11 1 0 34  5 29  34 2.83
## 2           Chelsea 12 10 2 0 29  9 20  32 2.67
## 3   Manchester City 12 10 2 0 29  9 20  32 2.67
## 4           Arsenal 12 10 1 1 28  9 19  31 2.58
## 5 Manchester United 12  8 3 1 21  8 13  27 2.25
## 6         Liverpool 12  8 1 3 28 13 15  25 2.08
As we suspected, Liverpool were the worst performers against the bottom 6 this season, averaging only 2.08 ppg against Swansea, Burnley, Watford, Hull, Boro, and Sunderland.
Defining ‘Hoodability’
The simplest starting point for our ‘Hoodability’ metric that I can think of is to simply compute the difference between ppg against the top 6 (top6_table) and ppg against the bottom 6 (bottom6_table) for each team. A ‘Hoodability’ > 0 represents true Robin Hood teams that redistributed points down the table by gained more points against the top 6 than against the bottom 6.
(I realise this might not be ideal: we lose potentially important information from recoding a continuous variable into two discrete groups and from ignoring performance against mid-table teams. For these reasons, some form of regression between ppg and relative team position might be more interesting, but I’ll come to that idea in the next post.)
## # A tibble: 6 x 2
##                team hoodability
##               <chr>       <dbl>
## 1         Liverpool       -0.08
## 2           Chelsea       -1.07
## 3 Manchester United       -1.25
## 4 Tottenham Hotspur       -1.33
## 5   Manchester City       -1.67
## 6           Arsenal       -1.68
As expected, Liverpool have the highest ‘Hoodability’ of the top 6 in 2016-17, although a negative value shows they still took marginally more points from the bottom than they did the top. 1
Historical ‘Hoodability’
Let’s have a look back through Premier League history to see if we can find any teams that were true football socialists for a season.
If we plot these 506 team seasons with ppg vs. top 6 on the x-axis and ppg vs bottom 6 on the y-axis below, then teams below the diagonal line y = x were a true Robin Hood that season.
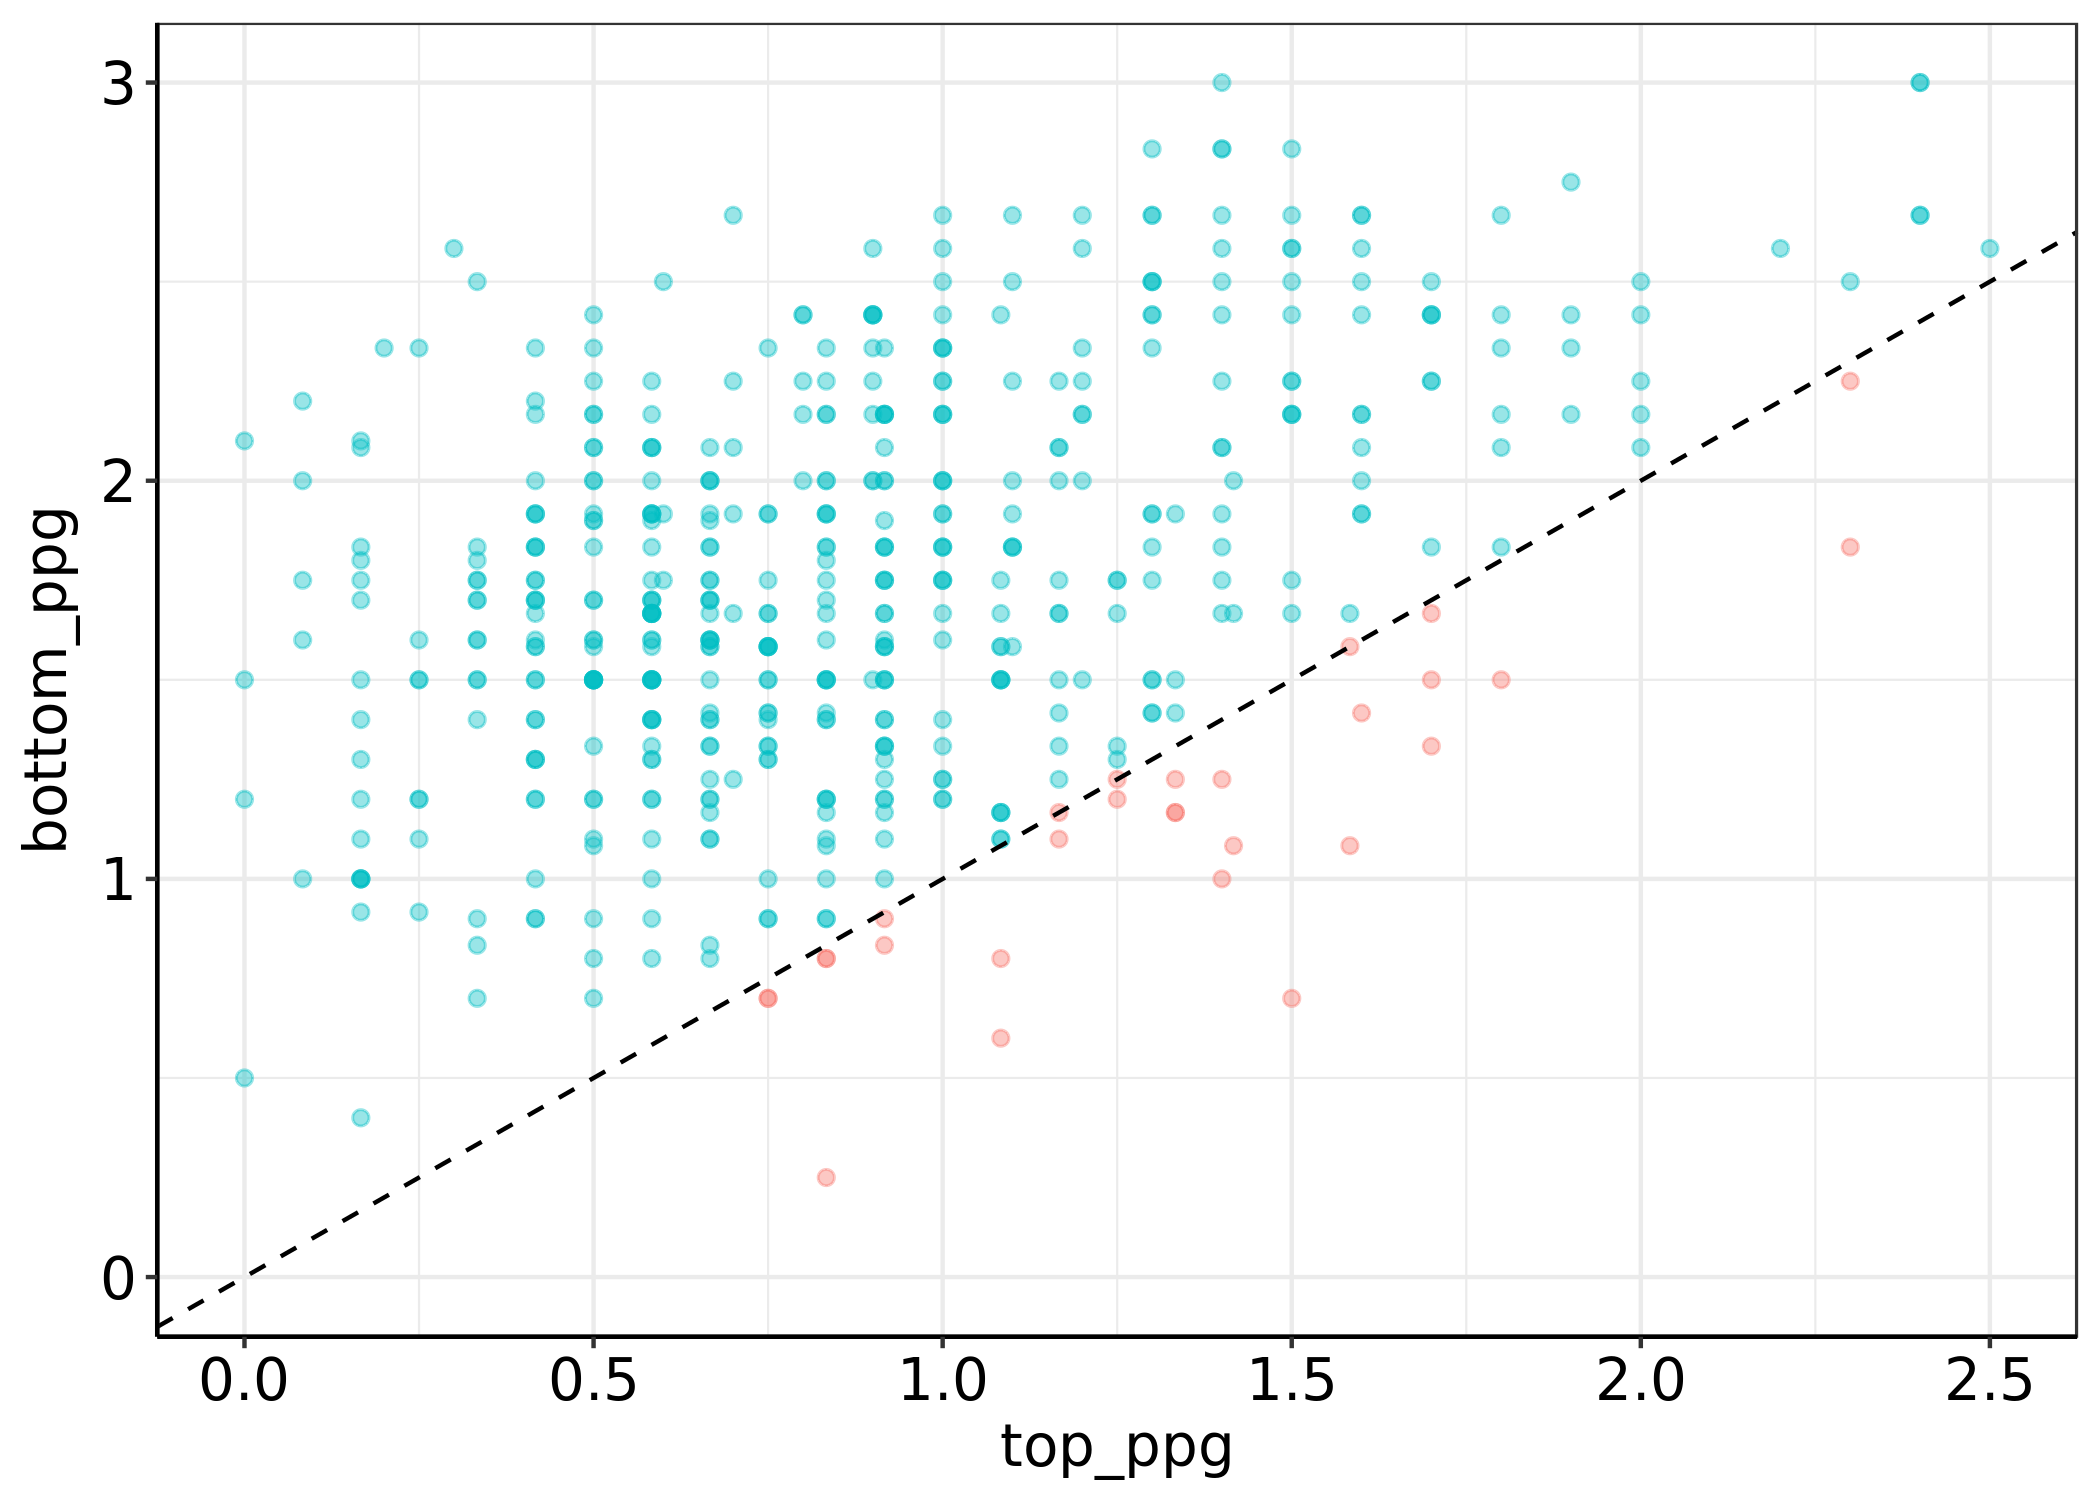
It turns out Robin Hoods are actually pretty rare, occurring only 26 times out of 506 team seasons. It turns out Liverpool weren’t a Robin Hood in 2009-10 season either (far from it in fact), although they do pop up twice below the dashed line. Let’s look at the identities of our 26 philanthropists and their top 6 / bottom 6 ppg in more detail with a dumbbell plot.

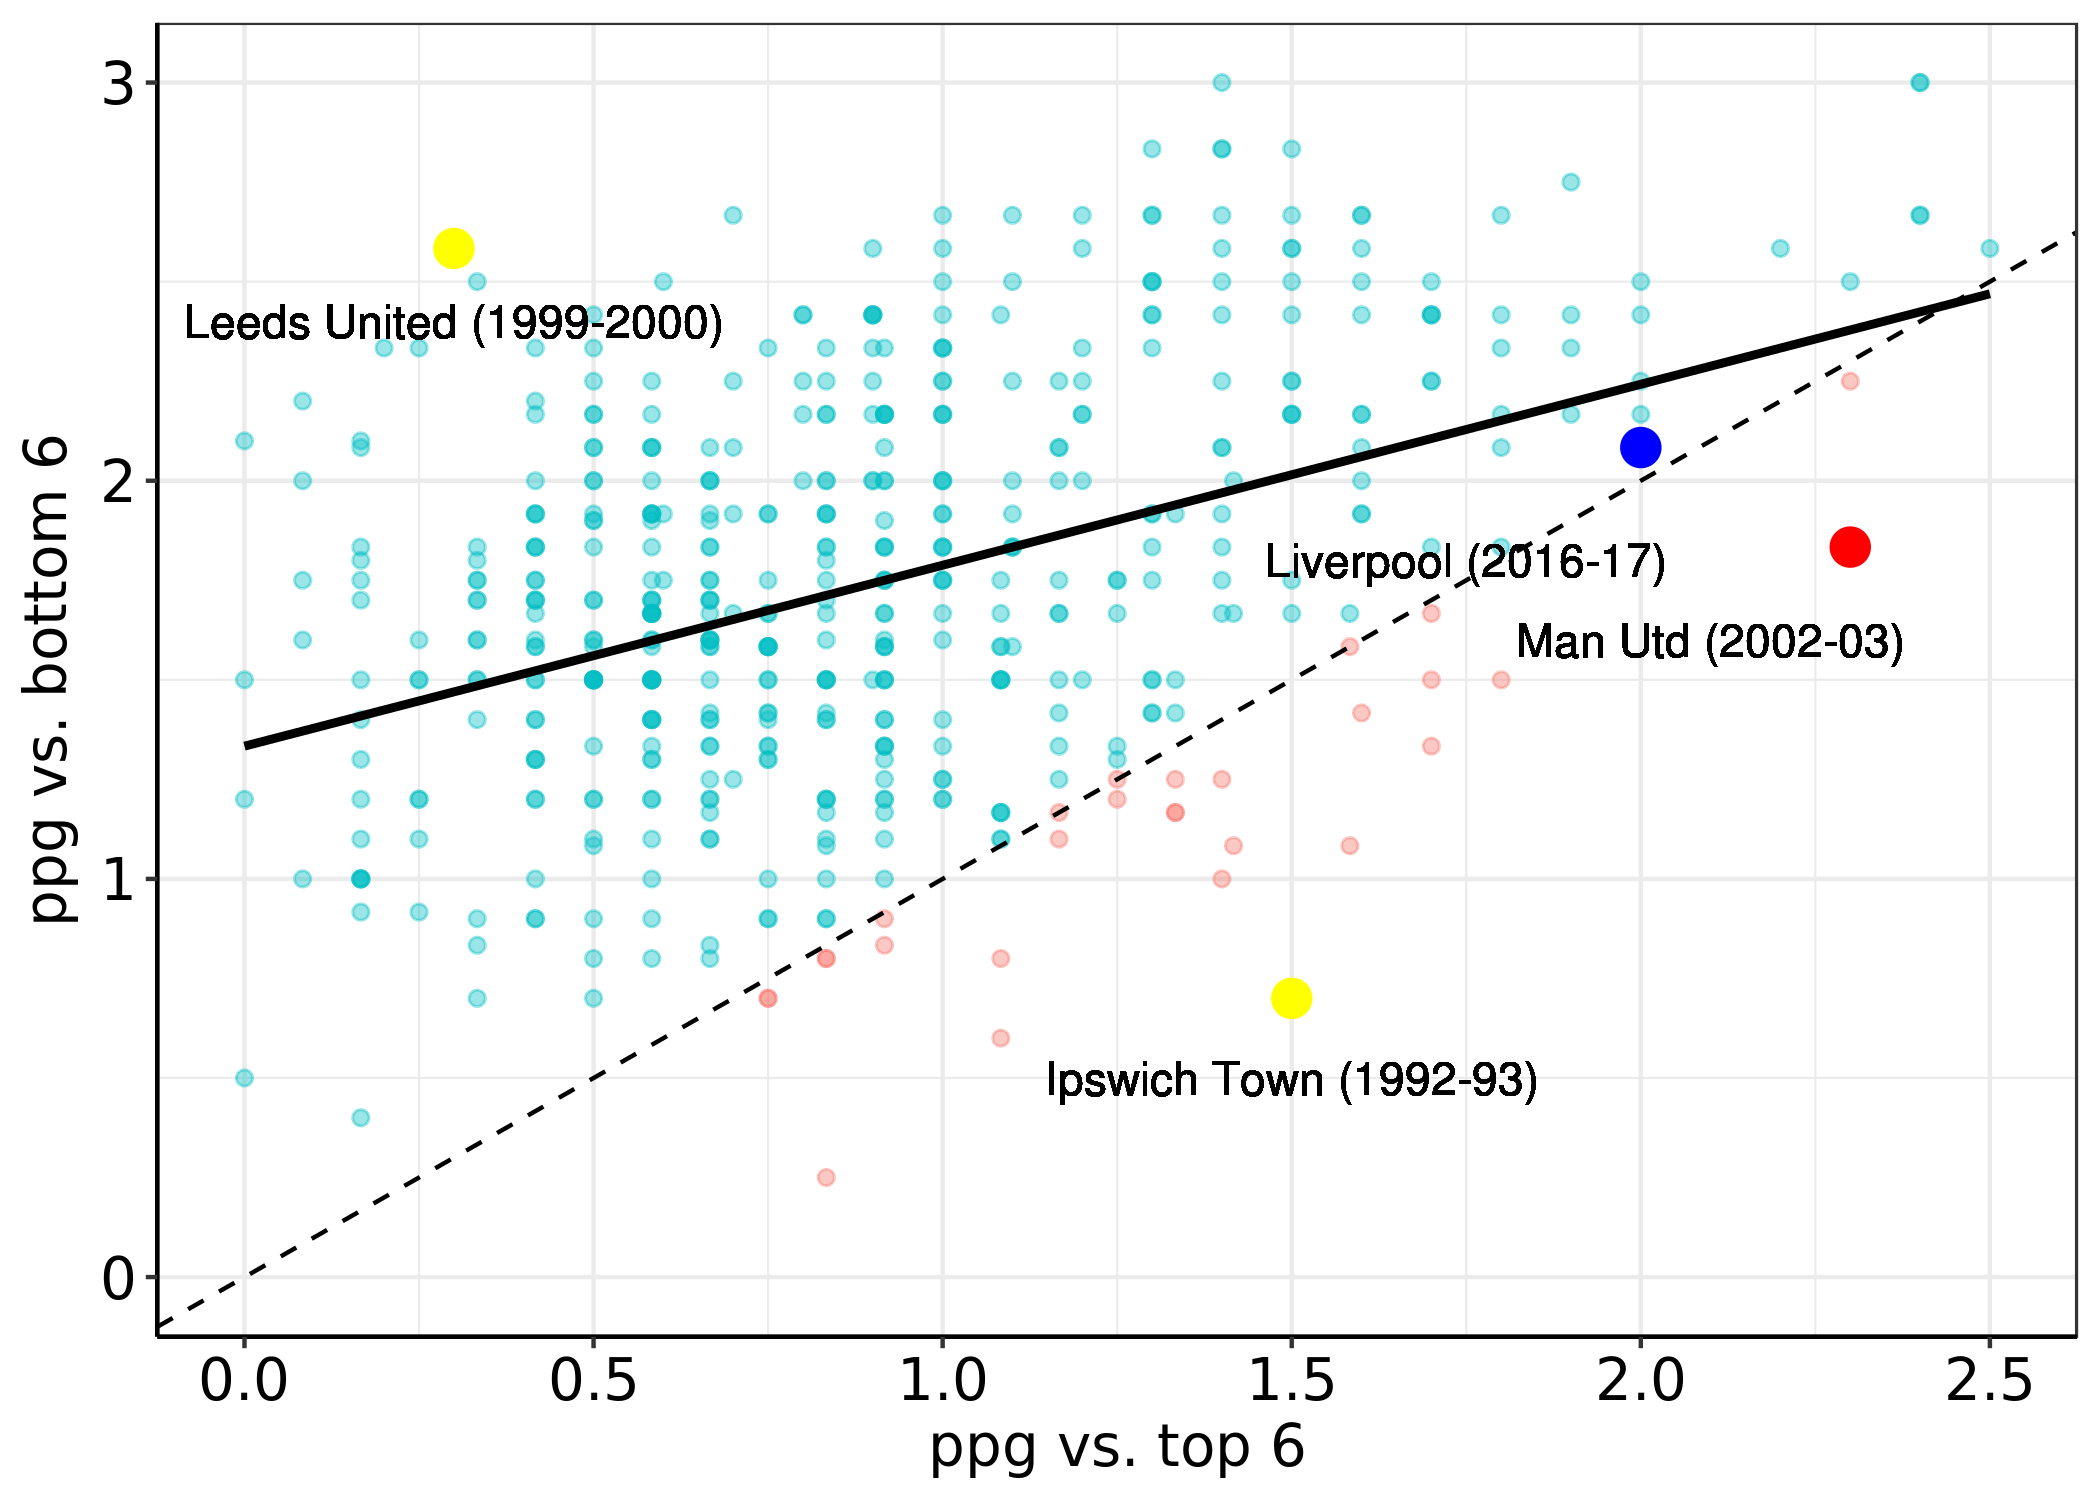
Most Robin Hoods appear to be teams that weren’t having particularly great seasons; all bar two teams gained less than 2 ppg against the top 6. Manchester United in 2002-03 stick out to the right hand side of the plot as the only Robin Hood team to win the Premier League. Chelsea finished 3rd in the 2013-14 season but with a much smaller ‘Hoodability’ score.
Ipswich Town occupy both the #1 and #2 positions of our greatest Robin Hood seasons; in 1992-93 they managed an impressive 1.5 ppg against the top 6 teams and just 0.7 ppg against the bottom 6 - an impressive redistribution of points! Meanwhile, Leeds United are the greatest antithesis to our Robin Hood idea with a ‘Hoodability’ score of -2.08 in the 1999-00 season. Let’s add these points of interest on our above scatter plot for some context.
So we’ve looked at individual seasons but who is the Premier League’s all-time greatest Robin Hood, i.e. the team with the highest average ‘Hoodability’ score? A cursory look reveals it’s Blackpool – in fact, they’re THE only true Robin Hood team:
## # A tibble: 47 x 2
##                       team hoodability
##                      <chr>       <dbl>
##  1               Blackpool  0.03333333
##  2         Oldham Athletic -0.39166667
##  3            Ipswich Town -0.39333333
##  4           Bradford City -0.45833333
##  5            Norwich City -0.46250000
##  6               Wimbledon -0.47708333
##  7          Leicester City -0.54242424
##  8 Wolverhampton Wanderers -0.57500000
##  9            Swindon Town -0.66666667
## 10           Coventry City -0.67037037
## # ... with 37 more rows
But that figure is only from a single season so it doesn’t tell us much about long-term patterns. How about we filter teams that have played 5 or more seasons?
## # A tibble: 35 x 3
##                    team hoodability n_seasons
##                   <chr>       <dbl>     <int>
##  1         Ipswich Town  -0.3933333         5
##  2         Norwich City  -0.4625000         8
##  3            Wimbledon  -0.4770833         8
##  4       Leicester City  -0.5424242        11
##  5        Coventry City  -0.6703704         9
##  6     Blackburn Rovers  -0.6935185        18
##  7 West Bromwich Albion  -0.6969697        11
##  8       Crystal Palace  -0.7104167         8
##  9            Liverpool  -0.7140000        25
## 10         Derby County  -0.7738095         7
## # ... with 25 more rows
So Ipswich Town are #1 overall by this definition too. Interesting to see Liverpool as the only side with >20 seasons in the top 10 though. How about filtering to include only Premier League mainstays, i.e. those who’ve played 20 seasons or more in the PL?
## # A tibble: 10 x 3
##                 team hoodability n_seasons
##                <chr>       <dbl>     <int>
##  1         Liverpool  -0.7140000        25
##  2 Manchester United  -0.7846667        25
##  3           Chelsea  -0.8326667        25
##  4  Newcastle United  -0.8439394        22
##  5   West Ham United  -0.8833333        21
##  6           Everton  -0.9133333        25
##  7       Aston Villa  -0.9312500        24
##  8   Manchester City  -0.9408333        20
##  9 Tottenham Hotspur  -1.0353333        25
## 10           Arsenal  -1.0406667        25
Liverpool sit on top of this table of Premier League regulars, suggesting they are the closest thing to Robin Hood in the top 6 at least.
Hoodability vs. performance
But is this a problem? Does ‘Hoodability’ have a negative effect on team performance over the season, i.e. final league position?
Obviously losing points is bad for any team’s chances of winning the league, but every team drops some points over the course of their campaign and one could argue that losing games against lower teams is better than losing them against those near the top. From Liverpool’s perspective, if you’re going to lose a game it’s better to gift those points to Sunderland than it is to Chelsea.
If we plot final league position against ‘Hoodability’, we see a very slight correlation: teams with higher ‘Hoodability’ tend to finish lower in the league.
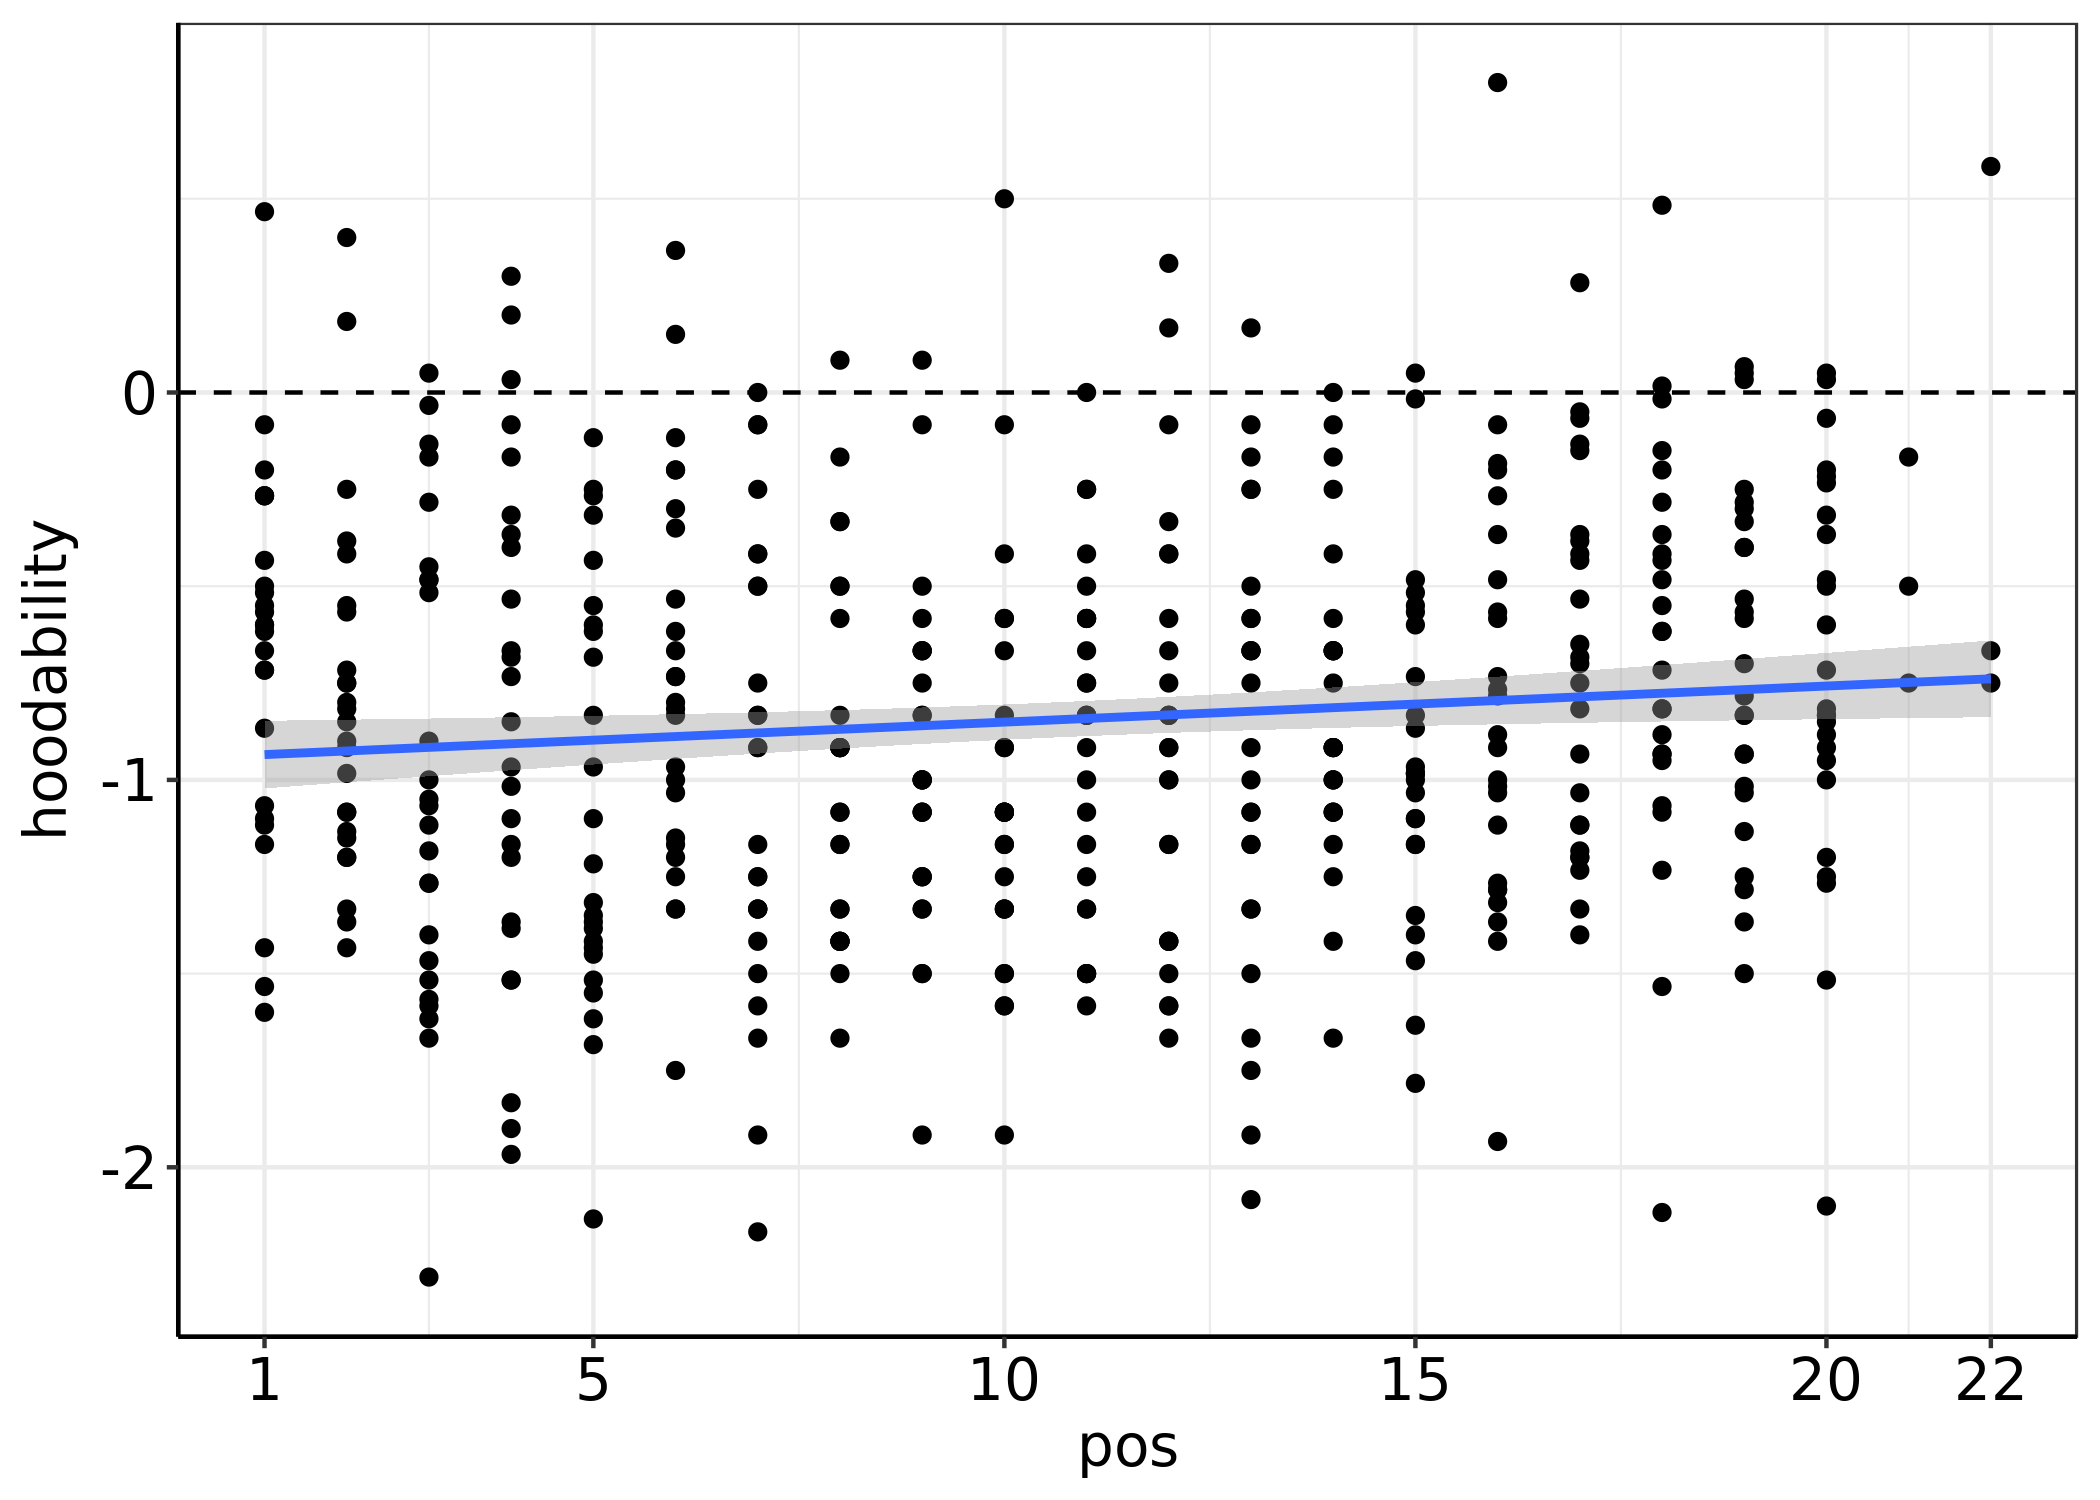
Perhaps surprisingly given the amount of scatter in this data, the correlation between these two measures is statistically significant (p < 0.05):
mod1 <- lm(formula = hoodability ~ pos, data = hoodability)
summary(mod1)
##
## Call:
## lm(formula = hoodability ~ pos, data = hoodability)
##
## Residuals:
##      Min       1Q   Median       3Q      Max
## -1.36727 -0.36531 -0.04717  0.36704  1.59498
##
## Coefficients:
##              Estimate Std. Error t value Pr(>|t|)
## (Intercept) -0.944002   0.047830 -19.737   <2e-16 ***
## pos          0.009314   0.003941   2.363   0.0185 *
## ---
## Signif. codes:  0 '***' 0.001 '**' 0.01 '*' 0.05 '.' 0.1 ' ' 1
##
## Residual standard error: 0.519 on 504 degrees of freedom
## Multiple R-squared:  0.01096,    Adjusted R-squared:  0.008997
## F-statistic: 5.585 on 1 and 504 DF,  p-value: 0.0185
The size of this effect though is very small: the slope of the curve is only 0.009, meaning that for every ~0.01 ppg a team ‘donates to charity’ (gives away to bottom teams instead of gives away to top teams), a team can expect to finish one position lower in the league. However, an r-squared of <0.01 suggests that the amount of variation in performance explained by ‘Hoodability’ is almost meaningless.
To be continued…
Nonetheless, there might be something interesting going on here if we dig a little deeper. In part two I’ll define a more rigorous ‘Hoodability’ metric that goes further than simply computing the difference in performance against the top 6 vs. the bottom 6 and measures performance against all other teams by their relative position in the league, i.e. how many positions an opponent is above or below that team in the league.
Stay tuned!
-
Perhaps that makes them as much philanthropists as the actual Robin Hood. ↩